Group Abstract Group Abstract

Message Boards Message Boards

0
|
2.4K Views
|
1 Reply
|
1 Total Like
View groups...
Share
Share this post:

How to find the overlapped area?

Posted 10 years ago

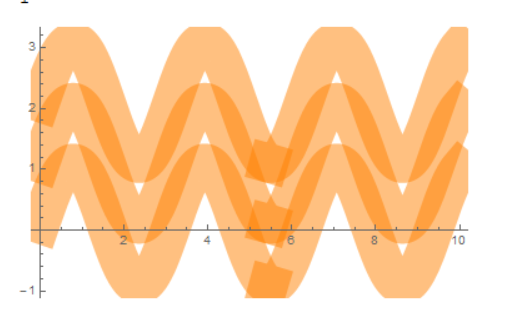
Hi, all of you! I intend to find out how many percentage of the plotted curves are overlapped(the more orange areas), which is very important for my project. Can anybody help me?

I used plotting parameters below:

R = 1
Vcp = 0.1
r = 0.09
w = 2
K = 1
Plot[{R*Sin[w*x] + Vcp, R*Sin[w*x] + K + Vcp, R*Sin[w*x] + 2*K + Vcp}, {x, 0, 10},  PlotStyle -> {{Orange, Opacity[0.5], Thickness[r]}, {Orange,Opacity[0.5], Thickness[r]}, {Orange, Opacity[0.5], Thickness[r]}}]

plot result

POSTED BY: Louis Lan

One way is to rasterize the graph and count the pixels of various colours:

R = 1; Vcp = 0.1; r = 0.09; w = 2; K = 1;
img = Rasterize@
   Plot[{R Sin[w x] + Vcp, R Sin[w x] + K + Vcp, 
     R Sin[w x] + 2*K + Vcp}, {x, 0, 10}, 
    PlotStyle -> {{Orange, Opacity[0.5], Thickness[r]}, {Orange, 
       Opacity[0.5], Thickness[r]}, {Orange, Opacity[0.5], 
       Thickness[r]}}, Axes -> False];
Tally[Flatten[ImageData[img], 1]]
POSTED BY: Gianluca Gorni
Reply to this discussion
Community posts can be styled and formatted using the Markdown syntax.
Reply Preview
Attachments
Remove
or Discard