Hi,
1) Create subscript, superscript
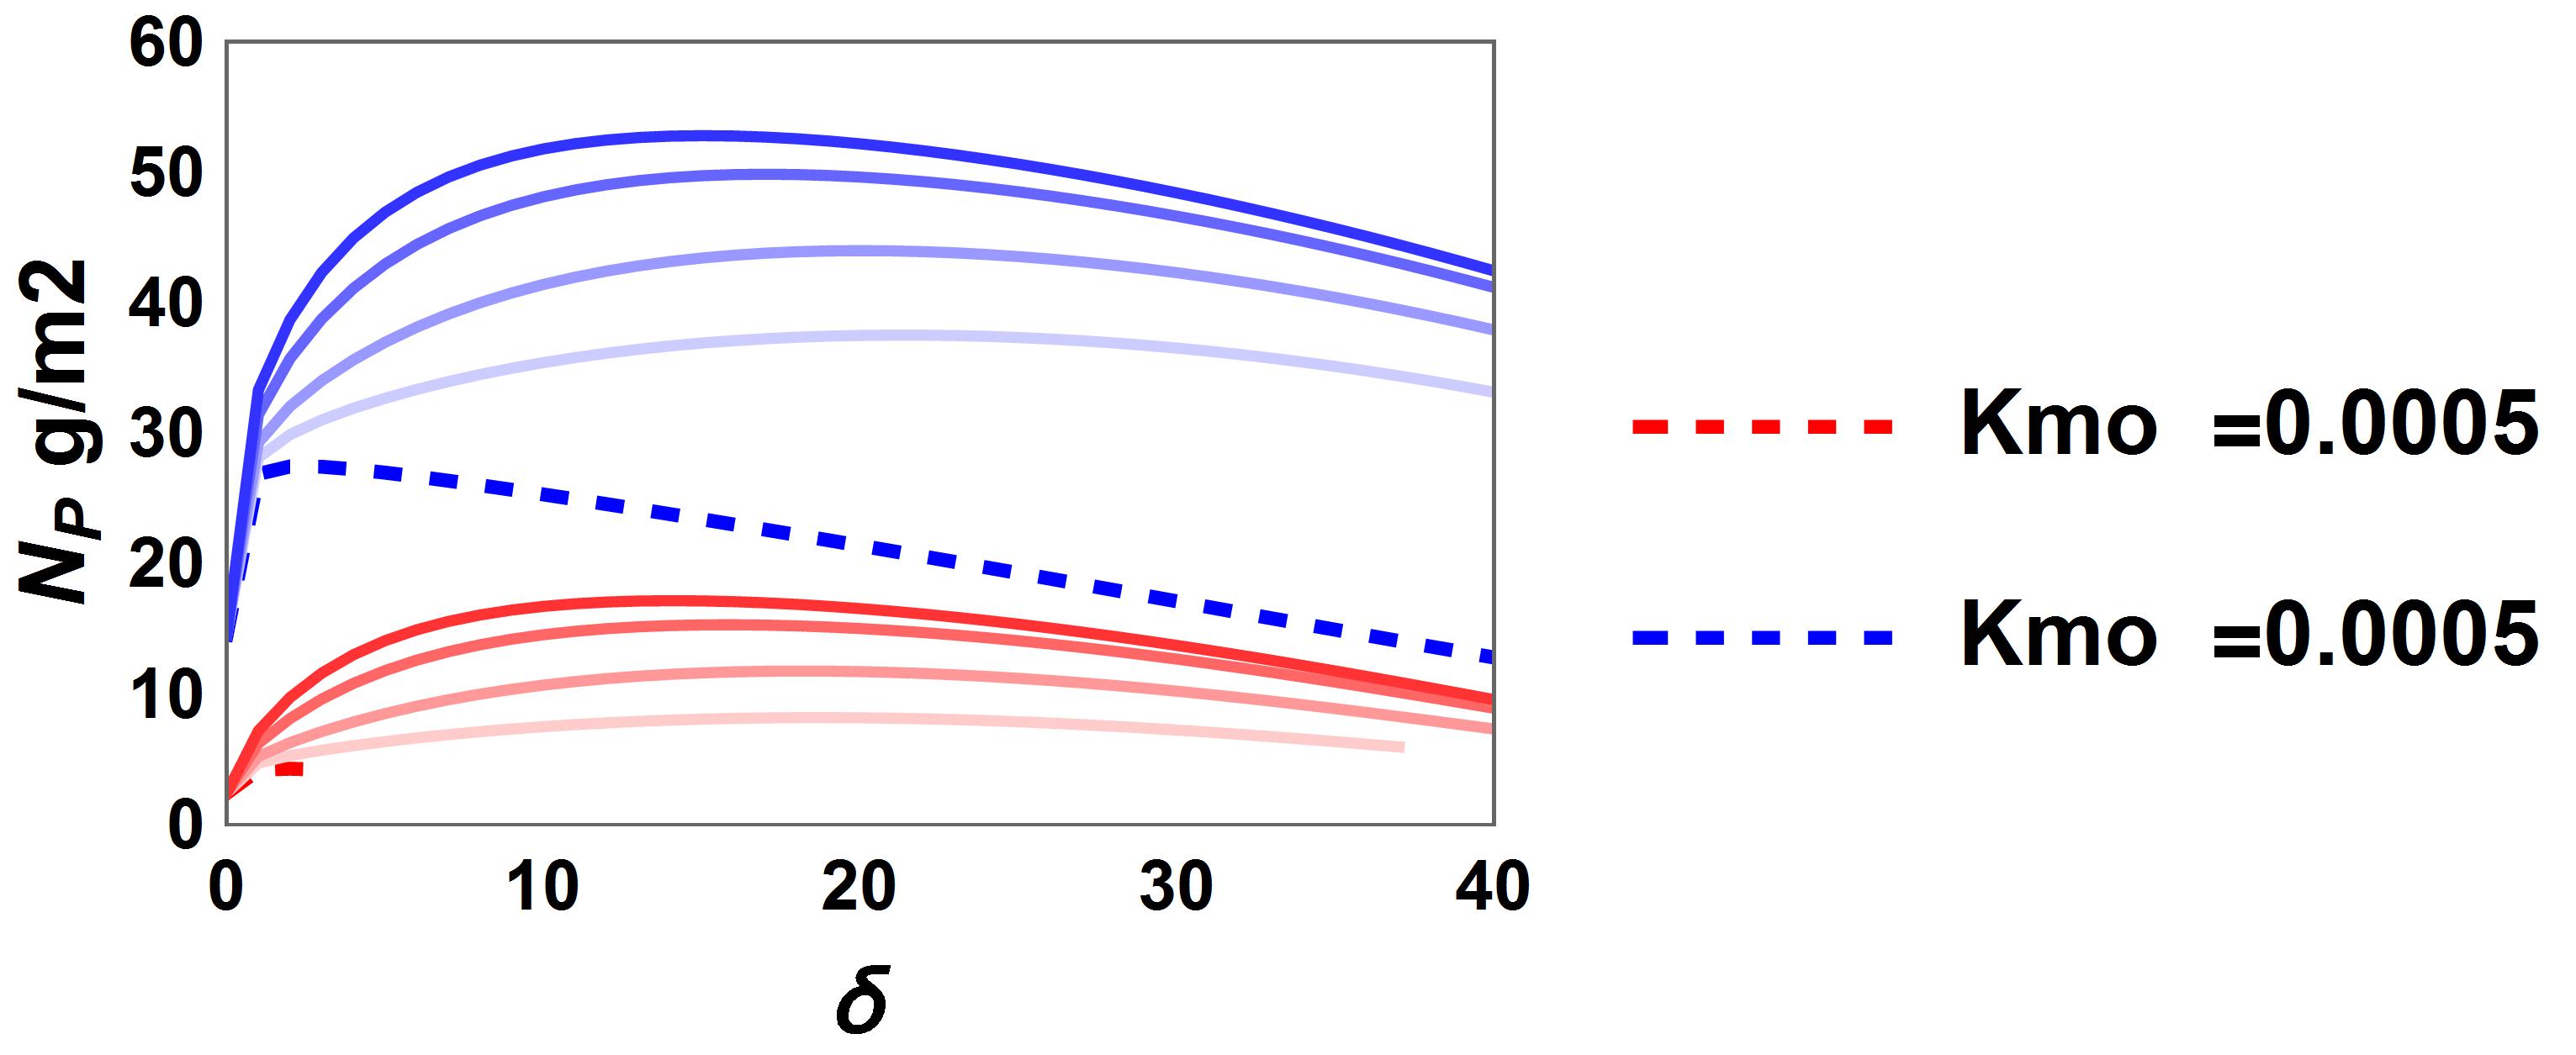
the plot command used to create this graph was something like
> Blockquote

lown = ListLinePlot[{tn1, tn2, tn3, tn4},
  PlotRange -> {{0, 40}, {0, 30}}, PlotStyle -> Reverse[colors],
  Frame -> True, LabelStyle -> {Black, Bold},
  FrameLabel -> {Style["\[Delta]", 13],
    Style["\!\(\*SubscriptBox[\(N\), \(P\)]\) g/m2", 13]}]

e = ListLinePlot[{tn0}, PlotRange -> {{0, 40}, {0, 30}},
  PlotStyle -> {{Red, Dashed, Thick}},
  PlotLegends -> {"Kmo  =0.0005", "Kmo = 0.001", "Kmo = 0.002",
    "Kmo = 0.003"}, Frame -> True, LabelStyle -> {Black, Bold},
  FrameLabel -> {Style["\[Delta]", 13],
    Style["\!\(\*SubscriptBox[\(N\), \(P\)]\) g/m2", 13]}]
Np = Show[e, lown,  PlotRange -> {{0, 40}, {0, 60}}]
I figured out how to make the subscript for Np..but i am struggling to make a superscript 2 in g/m2 and mo in kmo in the plot legend.. any help will be greatly apprecitaed thanks!
enter code here


