Who needs SQL in the cloud age?
This and followup tutorials will show how flexible data workflows can be built in Mathematica, relying on Google cloud-based apps (Drive, gsheet..) for storage, sync, and team co-editing.
I'll use examples from a large, time-and-motion study - called Quick- of computer use by doctors at two large institutions.
Here we show how index and perform basic file census in a few lines. The star is keyTrie: a one-liner recursive trie constructor that mirrors the entire filesystem (at the given root) as nested associations.
Suppose your data is stored under a common folder, here "~/Google Drive/VASD/Projects/Quick/Data" . All data here is de-identified (it has been cleaned up from versions that are in secure storage).
quick[index] = Dataset["~/Google Drive/VASD/Projects/Quick/Data"][fileIndex /* AssociationMap[Reverse]][keyTrie]
Preliminary timing studies show linear time complexity (http://mathematica.stackexchange.com/a/84952/80) - attributable to the efficient hash tree implementation of Association. (Be warned if you point keyTrie at a root directory "~/Google Drive" directory will take a while to complete.)
keyTrie = Query[keyGroupBy[First]] /* Query[All, KeyMap[Rest]] /* Query[All, If[Keys[#] == {{}}, First@Values[#], keyTrie[#]] &];
keyTrie uses the helper keyGroupBy, which is as useful as the built-in GroupBy when processing nested Associations - here is the operator form:
keyGroupBy[f_][expr_] := Association /@ GroupBy[Normal@expr, Keys /* f];
fileIndex is less interesting, but showing for completion: It filters data files, eg CSV, TXT, .gsheet etc and performs a basic filename cleanup (details upon request)
fileIndex[path_]  :=
  FileNames["*.csv" | "*.txt" | "*.xls" | "*.xlsx" | "*.gsheet", path, Infinity] //
     AssociationMap[Drop[StringSplit[#, "/"], Length@StringSplit[path, "/"]] &] //
    Dataset // Query[All,MapAt[First@StringSplit[#, {".", "-", "_"}] &, #, -1] &];
At this point, files comprise data and metadata and are only indexed, not imported.
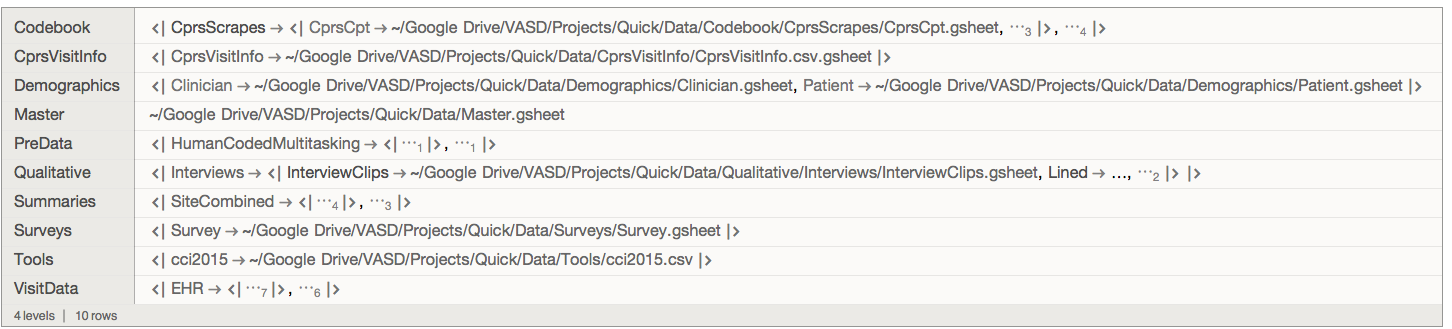
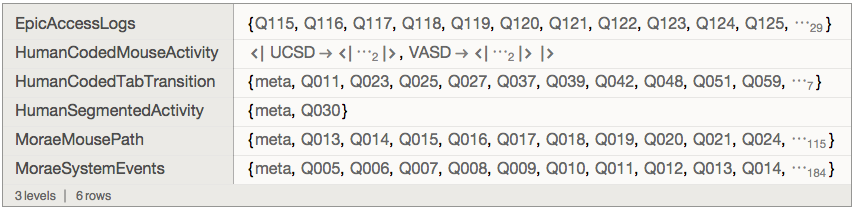
For example, here's what a portion of the folder under EHR looks like
quick[index]["VisitData", "EHR", preLeafMap[Keys]]
where identifiers Qxxx are units of study (patients, visits) - extracted from filenames by fileIndex above. Each file is typically a CSV or gsheet, eg:
quick[index]["VisitData", "EHR", First, First]
"~/Google Drive/VASD/Projects/Quick/Data/VisitData/EHR/EpicAccessLogs/Q115-18_epicLog.csv"
preLeafMap is a convenience operator form of Map applied at level -2:
preLeafMap[f_][expr_] := Map[f, expr, {-2}];
Note that nesting of files in folders varies by data layer, eg "HumanCodedMouseActivity" contains sub-folders "UCSD", "VASD".
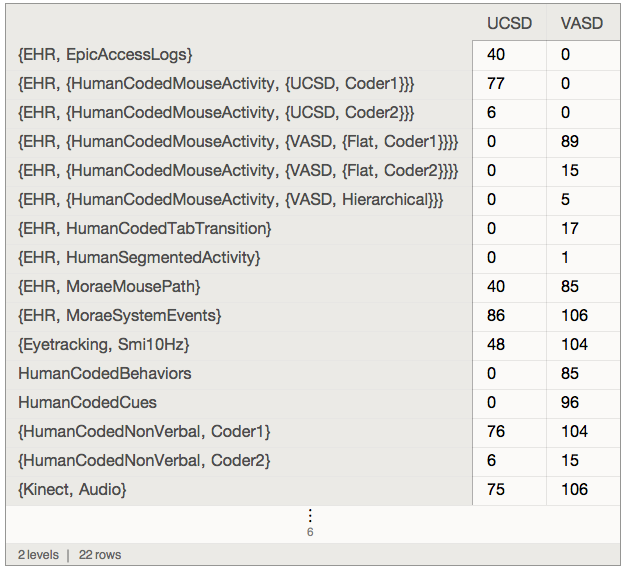
Using associationFlatten a census dashboard can be obtained easily: here scaled up to "VisitData":
quick[index]["VisitData", preLeafMap[KeyDrop["meta"] /* Keys] /* associationFlatten][All,
 GroupBy[quick[data]["Master", All, "Site"]] /* {"UCSD", "VASD"}, Replace[_Missing -> 0] /* Length]
where:
associationFlatten[as_Association] := Map[keyFlatten, as, {0, Infinity}];
and
keyFlatten[as_Association] :=
  as // KeyValueMap[
       List /* Replace[{{a_, b_Association} :>
           KeyMap[{a, #} &, b], {a_, b_} :> <|a -> b|>}]] //
     Map[Normal] // Flatten // Association;

keyFlatten[l_List] := l;

keyFlatten[a_ /; AtomQ[a]] := a;
Notes:
The grouping of the Qxxx into sites "UCSD" and "VASD" is based on metadata in the gsheet "Master" - which again is available to anyone in the team in real time for co-editing:
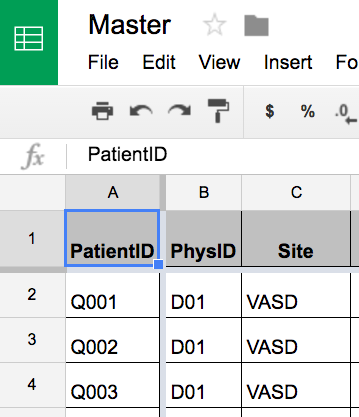
Once Master is imported, the GroupBy can use the derived association of PatientID to Site:
quick[data]["Master",All,"Site"]


