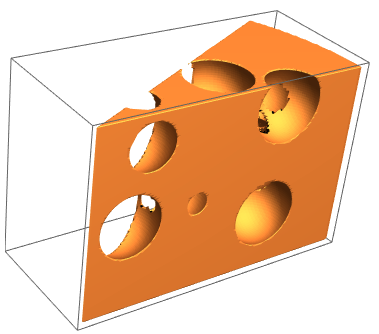
Ok, I'll assume that you stick to the rules of this community and that therefore this is not a homework problem, in spite of it being copied from a book. Also, this is a Mathematica community so I will ignore the bit about Matlab. It is quite straight forward to generate that region and then plot it:
RegionPlot3D[
 Fold[RegionDifference, ImplicitRegion[x^2 + y^2 <= 6^2 && 0 < z < 4 && 0 < y <= x Sin[Pi/6], {x, y, z}],
  Ball[#, 0.75] & /@ RandomPoint[ImplicitRegion[x^2 + y^2 <= 6^2 && 0 < z < 4 && 0 < y <= x Sin[Pi/6], {x, y, z}], 10]], PlotPoints -> 100]
Of course, you can define the region
reg = Fold[RegionDifference, ImplicitRegion[x^2 + y^2 <= 6^2 && 0 < z < 4 && 0 < y <= x Sin[Pi/6], {x, y, z}],
    Ball[#, 0.75] & /@ RandomPoint[ImplicitRegion[x^2 + y^2 <= 6^2 && 0 < z < 4 && 0 < y <= x Sin[Pi/6], {x, y, z}], 10]];
and then perform all sorts of calculations with it. For example calculate the volume:
Volume[reg]
In my case that gave 24.5828, but that will depend on the random position of the centres of the bubbles of course.
Cheers,
M.


