Okay, I'm stumped. The Internet and old Mathematica archives mention this problem, but I cannot get the solutions to work in my case.
I plot a rational expression. It shows the vertical asymptotes as part of the function, so I identify those as exclusions to turn them off. So far the code does what I expect:
Plot[(-1 + x^2 + 3 x^3 + 2 x^4)/((x + 1) (3 x - 2)), {x, -5, 5}, PlotRange -> {-5, 5}, Exclusions -> {x = -1, x = 2/3}]
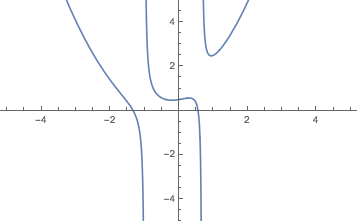
Now I'd like to plot those asymptotes in a different style, say dashed and red. There is an option for plotting called ExclusionsStyle, and the documentation shows that it is just what I need. However, when I try to use it, I must be doing something wrong because it doesn't draw the vertical asymptotes as dashed red lines as I had hoped. Sometimes the asymptotes don't appear at all, and when I experiment they sometimes appear in the same style as the rest of the graph. The code below produces the same plot as shown in the image above.
Plot[(-1 + x^2 + 3 x^3 + 2 x^4)/((x + 1) (3 x - 2)), {x, -5, 5},PlotRange -> {-5, 5}, Exclusions -> {x = -1, x = 2/3},ExclusionsStyle -> Directive[Dashed, Red]]
One workaround if I can't get ExclusionStyle to work for me is to plot the lines as separate expressions, but I'm not sure how to plot a vertical line. The Plot[] function seems to assume y = , which leaves vertical lines undefined.
(I am working on the desktop version of the Wolfram Development Platform on a Mac, if that makes any difference.)
Thanks in advance,
Mark Greenberg


