Dear Henrik,
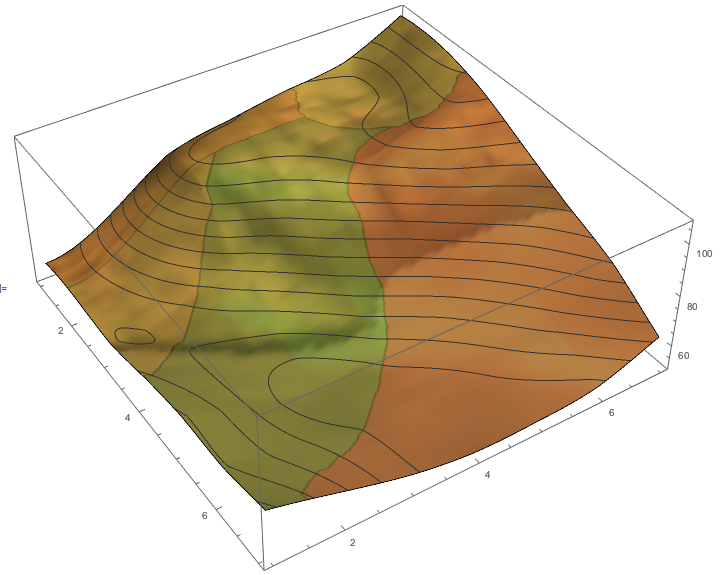
very nice indeed! What a beautiful contribution. I had a group of students this year who modelled rainfall-runoff from some digital elevation data. Your "mountain landscape" looks really nice for that. Here is the result for Aberdeen (UK)
ClearAll["Global`*"]
nn = 7;
data = QuantityMagnitude[
   GeoElevationData[
    GeoDisk[Entity[
      "City", {"Aberdeen", "AberdeenCity", "UnitedKingdom"}],
     Quantity[10, "Miles"]]]];
f = ListInterpolation[data];
(*test image:*)
img =
 DensityPlot[f[x, y], {x, 1, nn}, {y, 1, nn}, ImagePadding -> None,
  Frame -> None, ColorFunction -> GrayLevel]

(*water shed components of image*)
wsc0 = WatershedComponents[img];
(*example:merging regions with indices {8,9,10,(indx=)11}*)

indx = 11;
wsc1 = wsc0 /. {8 -> indx, 9 -> indx, 10 -> indx};

(*ensure there are no 0s at border pixel:*)

wsc1Pad = ArrayPad[wsc1, 1, -1];
(*detect 0-pixels:*)

nullIdx =
  First /@ Select[Flatten[MapIndexed[{#2, #1} &, wsc1Pad, {2}], 1],
    Last[#] == 0 &];

(*helper function for counting indx-pixels around coord*)

nearIndxCount[coord_, indx_] :=
 Module[{nears},
  nears = coord + # & /@ {{-1, -1}, {0, -1}, {1, -1}, {-1, 0}, {1,
      0}, {-1, 1}, {0, 1}, {1, 1}};
  Count[Extract[wsc1Pad, nears], indx]]

betweens =
  First /@ Select[{#, nearIndxCount[#, indx]} & /@ nullIdx,
    Last[#] > 3 &];
Set[wsc1Pad[[Sequence @@ #]], indx] & /@ betweens;
(*remove padding:*)
wsc1 = ArrayPad[wsc1Pad, -1];

Plot3D[f[x, y], {x, 1, nn}, {y, 1, nn}, ImageSize -> 700,
 PlotStyle ->
  Directive[Specularity[White, 100], Texture[Colorize@wsc1]],
 PlotPoints -> 50, MeshFunctions -> {#3 &}]

Plot3D[f[x, y], {x, 1, nn}, {y, 1, nn}, ImageSize -> 700,
 PlotStyle ->
  Directive[Specularity[White, 100],
   Texture[ImageCompose[{Colorize@wsc1,
      0.95}, {GeoGraphics[{GeoStyling[Opacity[0.0]],
        GeoDisk[Entity[
          "City", {"Aberdeen", "AberdeenCity", "UnitedKingdom"}],
         Quantity[10, "Miles"]]}, GeoBackground -> "ReliefMap"],
      0.65}]]], PlotPoints -> 100, MeshFunctions -> {#3 &}]
Thanks for posting!
Cheers,
M.
PS: I kept the black lines, because I like them.


