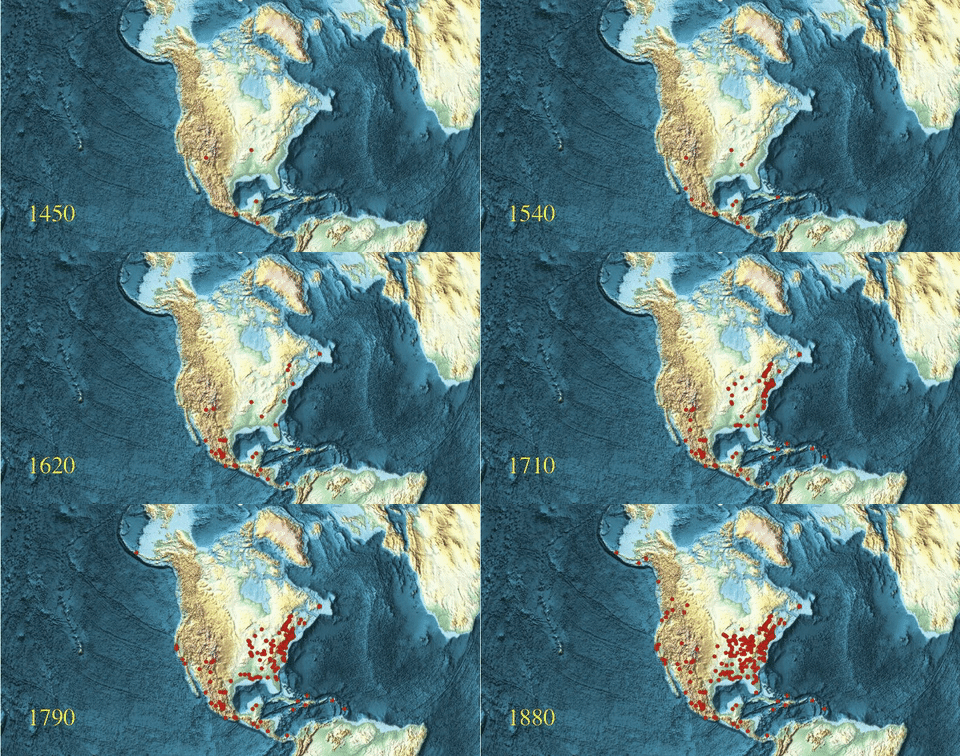
I just wanted to share a short animation, which shows (part of) the settlement history of North America, generated using half a dozen lines of code. I use data from a wikipedia page and the complete code is here:
pagedata = Import["https://en.wikipedia.org/wiki/List_of_North_American_settlements_by_year_of_foundation", "Data"];
dataclean = Take[#, UpTo[4]] & /@ pagedata[[1, 1, 3, 11 ;; 444]];
cities = Interpreter["City"][StringJoin[Riffle[#, " "]] & /@ dataclean[[All, 2 ;;]]];
dates = StringTake[ToString[#], UpTo[4]] & /@ pagedata[[1, 1, 3, 11 ;; 444]][[All, 1]];
cityfoundingdates = Select[Transpose[{ToExpression[dates], cities}], Head[#[[2]]] == Entity &];
Monitor[frames = Table[GeoListPlot[Select[cityfoundingdates, #[[1]] <= year &][[All, 2]], GeoRange -> Entity["GeographicRegion", "NorthAmerica"], ImageSize -> Full, GeoBackground -> "ReliefMap", Epilog -> Inset[Text[Style[ToString[year], 40, Yellow]], {-1.1, -0.5}]], {year, 1450, 1886, 1}];, year]
The code generates all the frames to produce the animation. You can either ListAnimate that (I would suggest decreasing the number of frames then to say one frame every 10 years) or export and merge them into one gif.
Do[Export["~/Desktop/SettlementsVideo/frame" <> ToString[1000 + k] <> ".jpg",frames[[k]]], {k, 1, Length[frames]}]
Here's the resulting video (low resolution and frame rate, but still 10 MB).

You can download the full 150MB file from here. Here is an explanation of the different major events. It might be nice for pupils to generate this map using the Wolfram Language.
Cheers,
Marco