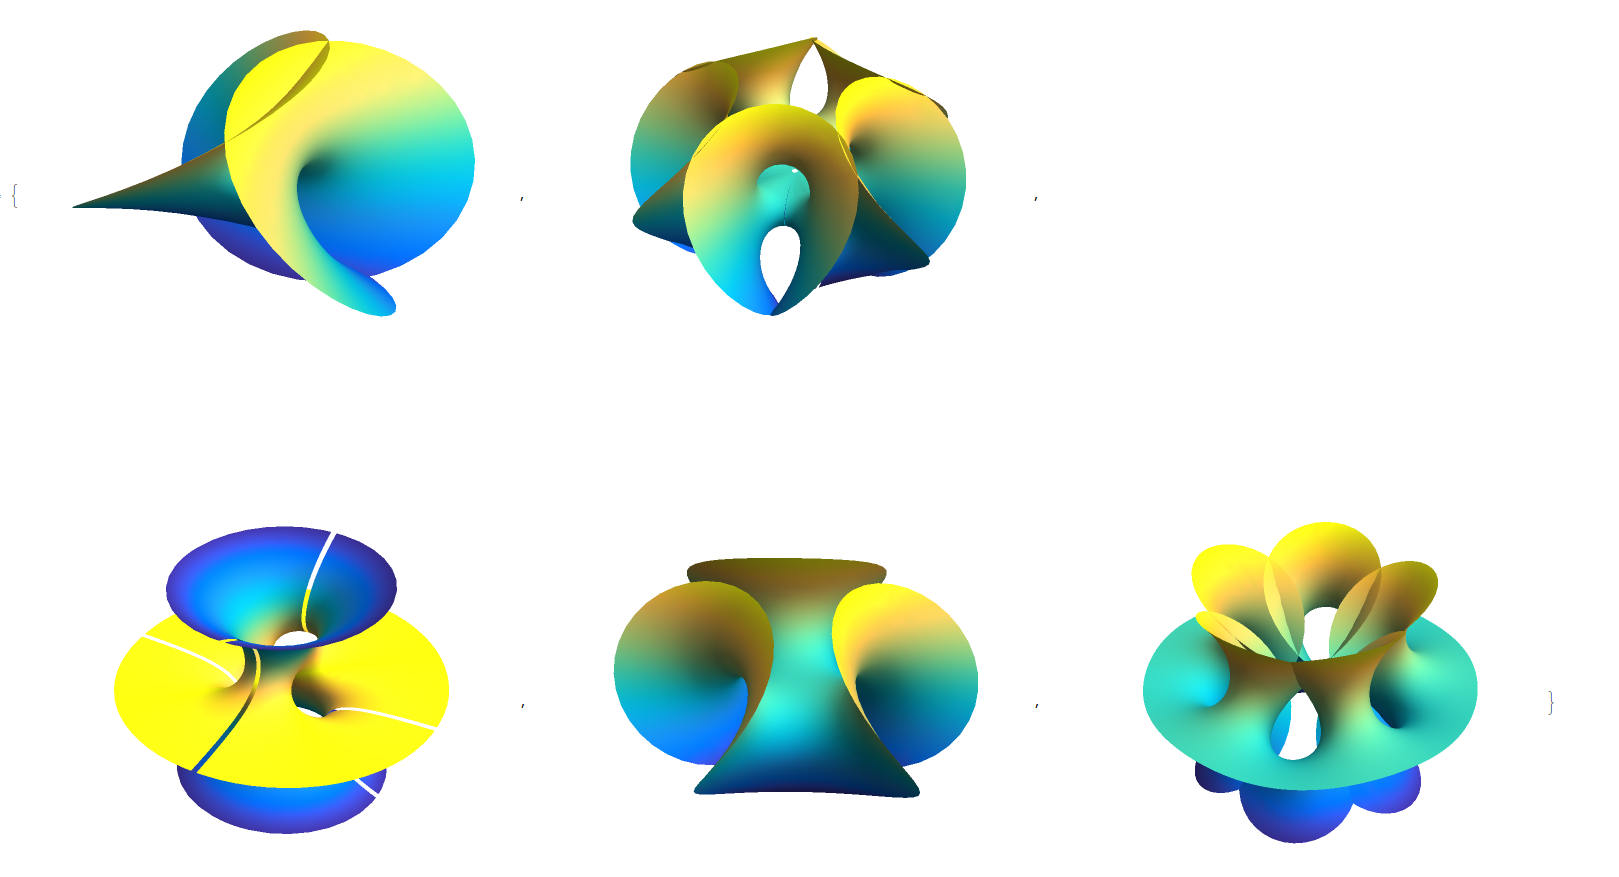
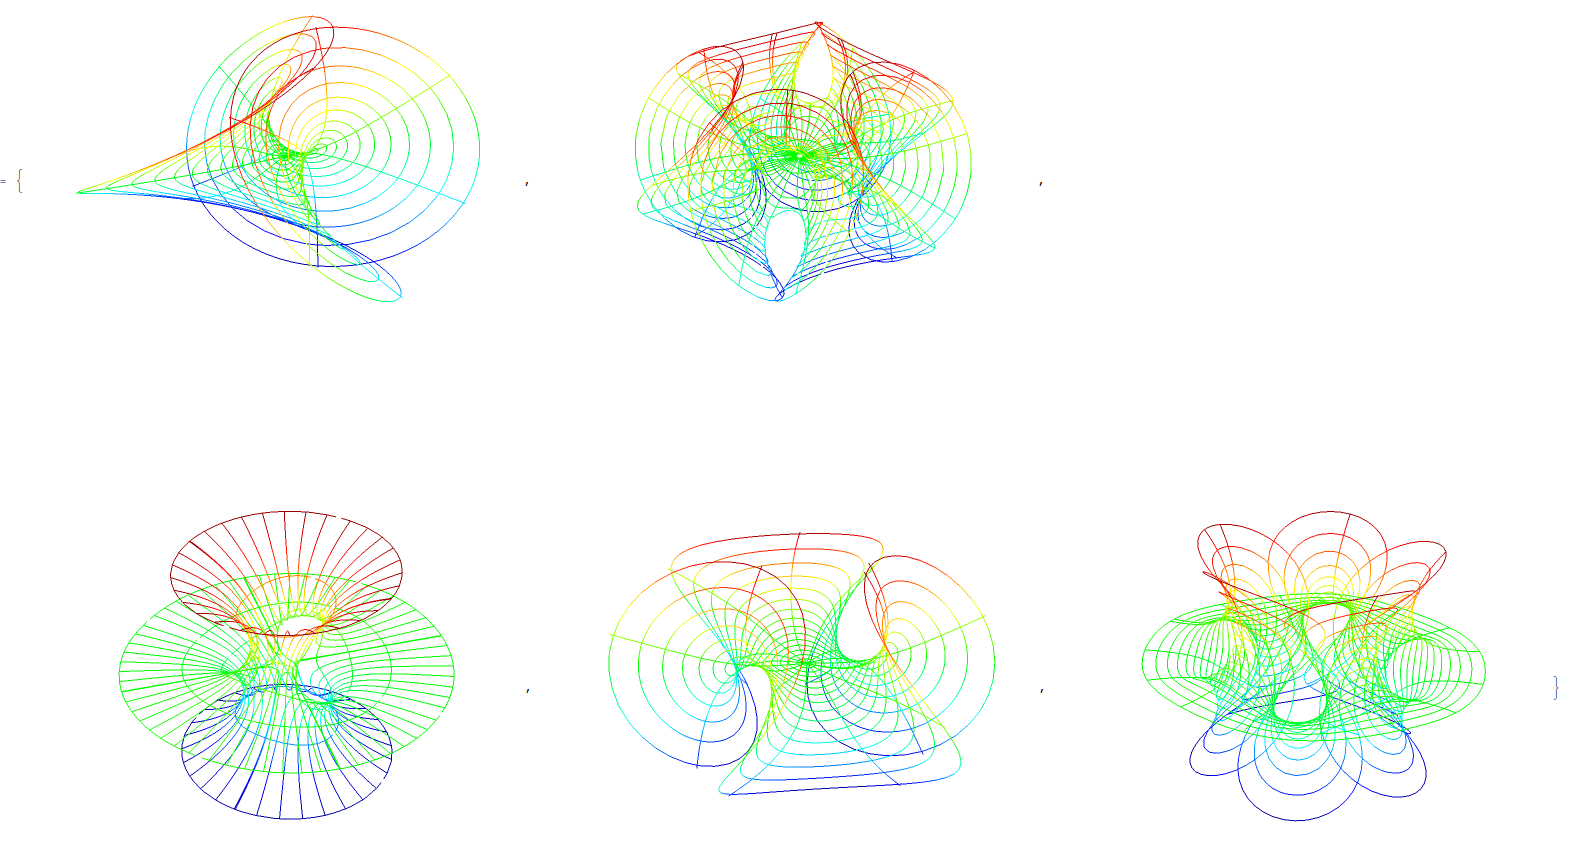
I was really impressed by the 3D plots of minimal surfaces on Paul Nylander's page here. You can read about the mathematics of minimal surfaces here.
The code on Paul's page was written for version 4.2, so it took a small amount of updating. I will show the plots before dumping the code. First I show the surfaces with no mesh,

and here are the surfaces with only mesh (which took a bit of trickery, extracting the Mesh lines and then coloring them)

Here is the code for the first set of images, with the first line being used to import a nice color function that I prefer,
<< "http://pastebin.com/raw.php?i=sqYFdrkY";
chenGackstatterSurface = Module[{k = 5, n, rho,
    phi, rotateShape, surface, graphics, minmax, f},
   n = (k - 1)/k;
   rho = 1.0/
     Sqrt[4^n Gamma[(3 - n)/2] Gamma[
         1 + n/2]/(Gamma[(3 + n)/2] Gamma[1 - n/2])];
   phi[n_, z_] :=
    z^(1 + n) Hypergeometric2F1[(1 + n)/2, n, (3 + n)/2, z^2]/(1 + n);
    f[z_] := {0.5 (phi[n, z]/rho - rho phi[-n, z]),
     0.5 I (rho phi[-n, z] + phi[n, z]/rho), z};
   rotateShape[shape_, a_, b_, c_] :=
    GeometricTransformation[shape, EulerMatrix[{a, b, c}]];
   surface =
    ParametricPlot3D[
     Re[f[r Exp[I theta]]], {r, -0.0, 3.0}, {theta, 0, 2.00 Pi},
     PlotPoints -> 25, ColorFunction -> (ParulaCM[#3] &),
     Mesh -> None];
   graphics =
    Show[Graphics3D[
      Table[rotateShape[surface[[1]], 0, 0, 2. Pi i/k], {i, 0,
        k - 1}]], Boxed -> False, ImageSize -> 500]
   ];

firstEnneperSurface = Module[{n = 3, surface, minmax},
   surface = ParametricPlot3D[{
      r Cos[th] - r^3/3 Cos[3 th],
      -r/3 (3 Sin[th] + r^2 Sin[3 th]),
      r^2 Cos[2 th]
      }, {r, 0, 2}, {th, -\[Pi], \[Pi]},
     PlotPoints -> {100, 100}, PlotRange -> All,
     Mesh -> None,
     ColorFunction -> (ParulaCM[#3] &),
     BoxRatios -> {1.5, 1.5, 1},
     Boxed -> False,
     Axes -> False,
     ImageSize -> 500]];
richmondsMinimalSurface = Module[{Richmond, surface, minmax},
   Richmond[n_,
     z_] := {-1/(2 z) - z^(2 n + 1)/(4 n + 2), -I/(2 z) +
      I z^(2 n + 1)/(4 n + 2), z^n/n};
   surface =
    ParametricPlot3D[
     Re[Richmond[5, r Exp[I theta]]], {r, 0.52, 1.18}, {theta, 0,
      2 Pi}, PlotPoints -> {25, 180},
     Mesh -> None,
     ColorFunction -> (ParulaCM[#3] &),
     BoxRatios -> {1.5, 1.5, 1},
     Boxed -> False,
     Axes -> False,
     ImageSize -> 500]
   ];
fourthEnneperSurface = Module[{n = 3, surface, minmax},
   surface = ParametricPlot3D[{
      r Cos[phi] - r^(2 n - 1) Cos[(2 n - 1) phi]/(2 n - 1),
      r Sin[phi] + r^(2 n - 1) Sin[(2 n - 1) phi]/(2 n - 1),
      2 r^n Cos[n phi]/n},
     {phi, 0, 2 Pi}, {r, 0, 1.3},
     PlotPoints -> {150, 20}, PlotRange -> All,
     Mesh -> None,
     ColorFunction -> (ParulaCM[#3] &),
     BoxRatios -> {1.5, 1.5, 1},
     Boxed -> False,
     Axes -> False,
     ImageSize -> 500]
   ];
costasMinimalSurface =
  Module[{rotateShape, surface, graphics, minmax, Costa},
   rotateShape[shape_, a_, b_, c_] :=
    GeometricTransformation[shape, EulerMatrix[{a, b, c}]];
   Costa[z_] :=
    Module[{phi1 = -2 Sqrt[z] Sqrt[
         1 - z^2] Hypergeometric2F1[1/4, 3/2, 5/4, z^2]/Sqrt[z^2 - 1],
       phi2 = -(2/3) z^(3/2) Sqrt[
         z^2 - 1] Hypergeometric2F1[3/4, 1/2, 7/4, z^2]/Sqrt[1 - z^2]},
     Re[{phi2 - phi1, I (phi1 + phi2), Log[z - 1] - Log[z + 1]}]/2];
   surface = ParametricPlot3D[
      Costa[Sqrt[Exp[r - I theta] + 1]],
      {r, -3.5, 6}, {theta, -Pi, Pi},
      PlotPoints -> {75, 18},
      Mesh -> None,
      ColorFunction -> (ParulaCM[#3] &)][[1]];
   surface = {surface, rotateShape[surface, Pi, 0, 0]};
   graphics =
    Show[Graphics3D[{surface, rotateShape[surface, Pi/2, Pi, 0]}],
     BoxRatios -> {1.5, 1.5, 1},
     Boxed -> False,
     ImageSize -> 500]
   ];
{firstEnneperSurface, chenGackstatterSurface, costasMinimalSurface, fourthEnneperSurface, richmondsMinimalSurface}
and here is the code for the second set of images:
costasMinimalSurface =
  Module[{rotateShape, surface, graphics, minmax, Costa},
   rotateShape[shape_, a_, b_, c_] :=
    GeometricTransformation[shape, EulerMatrix[{a, b, c}]];
   Costa[z_] :=
    Module[{phi1 = -2 Sqrt[z] Sqrt[
         1 - z^2] Hypergeometric2F1[1/4, 3/2, 5/4, z^2]/Sqrt[z^2 - 1],
       phi2 = -(2/3) z^(3/2) Sqrt[
         z^2 - 1] Hypergeometric2F1[3/4, 1/2, 7/4, z^2]/Sqrt[1 - z^2]},
     Re[{phi2 - phi1, I (phi1 + phi2), Log[z - 1] - Log[z + 1]}]/2];
   surface = ParametricPlot3D[
      Costa[Sqrt[Exp[r - I theta] + 1]],
      {r, -3.5, 6}, {theta, -Pi, Pi},
      PlotPoints -> {75, 18},
      Mesh -> {Subdivide[-3.499, 5.99, 5],
        Subdivide[-\[Pi] + .01, \[Pi] - .01, 15]},
      PlotStyle -> None][[1]];
   surface = {surface, rotateShape[surface, Pi, 0, 0]};
   graphics =
    Show[Graphics3D[{surface, rotateShape[surface, Pi/2, Pi, 0]}],
     BoxRatios -> {1.5, 1.5, 1},
     Boxed -> False,
     ImageSize -> 500];
   minmax = Charting`get3DPlotRange@graphics // Last;
   Normal[graphics] /.
    Line[x__] :> ({JetCM[Rescale[#[[1, 3]], minmax]], Line[#]} & /@
       Partition[x, 2, 1])
   ];


{firstEnneperSurface, chenGackstatterSurface, costasMinimalSurface, fourthEnneperSurface, richmondsMinimalSurface}