Group Abstract Group Abstract

Message Boards Message Boards

Fitting data using a Nonlinear model?

Hi I am trying to fit data to the equation using Nonlinear fit model but always getting error. Please see the attached file. Any advise will be appreciated. Many thanks Riyadh

Attachments:
POSTED BY: Riyadh Al Asady
7 Replies

Thanks. 0,0 is not real but if the x=0 then y must equal to 0 as there is no physical meaning for it. For this data the x is the particle size and y is the % of the particle volume. Thanks Riyadh

POSTED BY: Riyadh Al Asady
Posted 10 years ago

You can obtain the R2 value with nlm["RSquared"] which results in the value 0.998224. But this does not mean that you have a good fit. The low and the high x values underestimate where the data is observed and the middle third overestimates where the data is observed.

Also, I understand about the curve starting at (0,0). But is the {0,0} in the data actual data or is it just a theoretical value? If the latter, then it shouldn't be treated as data.

POSTED BY: Jim Baldwin

Hi Jim, Thanks for this. It works well. I need the R2 value to be displayed with the results? Many thanks Riyadh

POSTED BY: Riyadh Al Asady
Posted 10 years ago

Try

ListPlot[data, AxesOrigin -> {0, 0}]

to force the plot to include the origin at 0,0

POSTED BY: Bill Simpson

Hi Bill, Thank you for answer. I just tried to do it again but it came with curve not starting at the 0,0 points (Please see attached file) Actually i need the curve to start at 0,0 point. Your curve looks all right but i dont know how you managed to plot it like this.

Many thanks Riyadh

Attachments:
POSTED BY: Riyadh Al Asady
Posted 10 years ago

You have a few typos but after those are corrected the fix is to have better starting values for the parameters (as the default starting values for both xc and m are 1.

data = {{0, 0}, {30, 18.186}, {60, 30.98166667}, {90, 39.843}, {120, 45.865}, {150, 51.274},
    {180, 55.98333333}, {210, 60.13}, {240, 63.81933333}, {270, 67.398}, {300, 70.59},
    {330, 73.8}, {360, 76.9}, {390, 79.5}, {420, 82}, {450, 85}, {480, 88.16}, {510, 91.68}, 
    {540, 94.2}, {570, 95.73}, {600, 96.9}, {630, 99.042}, {660, 99.3}, {690, 99.7}, {720, 99.82}, 
    {750, 100}, {780, 100}, {810, 100}, {840, 100}, {870, 100}};
nlm = NonlinearModelFit[data, 100 (1 - Exp[-Abs[x/xc]^m]), {{xc, 10}, m}, x];
nlm["BestFitParameters"]
(* {xc -> 213.862, m -> 0.951079} *)

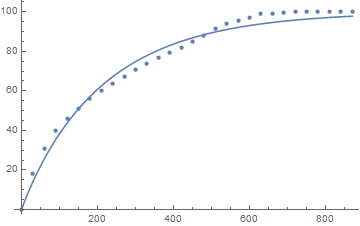
But the fit is not great:

Show[ListPlot[data],
Plot[nlm[x], {x, Min[data[[All, 1]]], Max[data[[All, 1]]]}]]

Data and fit

POSTED BY: Jim Baldwin
Posted 10 years ago

Perhaps

data = {{30, 18.186}, {60, 30.98166667}, {90, 39.843}, {120,45.865}, {150, 51.274}, {180, 55.98333333},
  {210, 60.13}, {240, 63.81933333}, {270, 67.398}, {300, 70.59}, { 330, 73.8}, {360, 76.9}, {390, 79.5},
  {420, 82}, {450, 85}, {480, 88.16}, {510, 91.68}, {540, 94.2}, {570, 95.73}, {600, 96.9}, {630, 99.042},
  {660, 99.3}, {690, 99.7}, {720, 99.82}, {750, 100}, {780, 100}, {810, 100}, {840, 100}, {870, 100}};
sol=NMinimize[Total[Map[(x=First[#];Norm[100(1-Exp[-Abs[x/xc]^m])-Last[#]])&, data]],{xc,m},Method->"RandomSearch"]

which returns

{92.2072, {xc -> -220.501, m -> 0.974246}}

and then

Show[ListPlot[data], Plot[100 (1 - Exp[-Abs[x/xc]^m]) /. Last[sol], {x, 0, 870}]]

enter image description here

Look carefully for the changes I have made to your original file. You can try carefully undoing those changes one at a time and see the results.

POSTED BY: Bill Simpson
Reply to this discussion
Community posts can be styled and formatted using the Markdown syntax.
Reply Preview
Attachments
Remove
or Discard