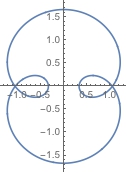
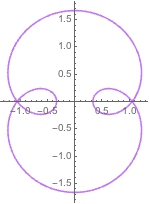
Okay, so I've realized that what I'm trying to do is vary the Hue or shade of the curve by it's curvature.
ParametricPlot[{Sin[t] + 2/3 Sin[3 t], Cos[t] + 2/3 Cos[3 t]}, {t, 0, 2 Pi}]

So the loops with more curvature would appear a different color than the flatter parts of the curve. No luck so far. I've tried:
x = Sin[t] + 2/3 Sin[3 t];
y = Cos[t] + 2/3 Cos[3 t];

curvature = (D[x, t] D[y, {t, 2}] -D[y, t] D[x, {t, 2}])/(D[x, t]^2 + D[y, t]^2)^(3/2)


ParametricPlot[{Sin[t] + 2/3 Sin[3 t], Cos[t] + 2/3 Cos[3 t]}, {t, 0, 2 Pi},
ColorFunction -> Function[{x, y, t}, ColorData["Pastel"][curvature]]]

(Doesn't work). I've also tried
ColorFunction -> Function[{x, y, t}, Hue[curvature]]
to no avail. And I looked into ArcCurvature and FrenetSerretSystem but couldn't come up with a solution. Any ideas?