Hi,
without data it is hard to tell what the problem is - so Marcos answer has some background. To have a hopefully appropriate example at hand I created a 3D array of data describing a 3D dose distribution of a 15MeV electron beam in water. Then I get:
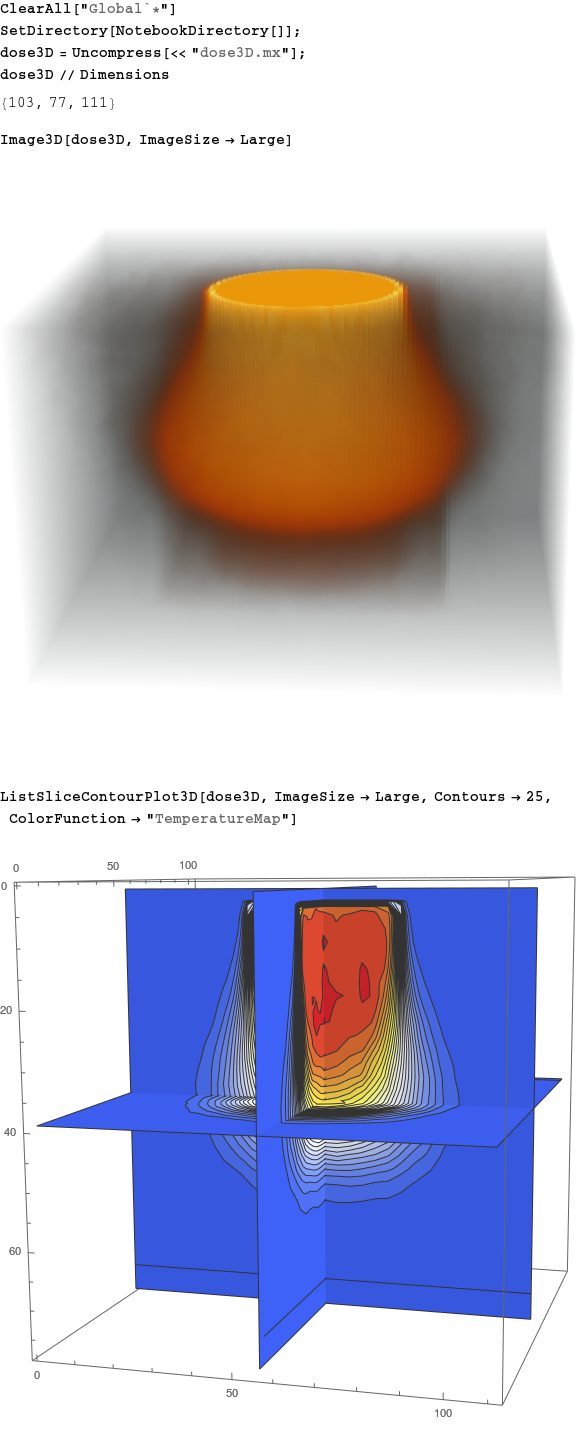
(Code and data come as an attachment.) I basically want to communicate that if Image3D does not work for you, then you can use the nice functions ListSliceDensityPlot3D, ListSliceContourPlot3D and friends.
BTW: A simple way to apply a function to the values of a multidimensional array is e.g.:
Attributes[logScale] = Listable;
logScale[dose_] := Piecewise[{{0, dose < 0.001}}, Log[1. + dose]]

logDose3D = logScale[dose3D];
Regards -- Henrik
 Attachments:


