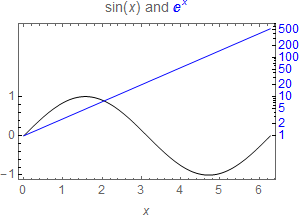
The following are two examples from my Presentations Mathematica application, which I sell for $50. You can contact me for more information, The first example uses a CustomTicks routine. It allows linear, log and date scales, and any monotonic mapping function. The details of the ticks and labeling can be controlled and minor ticks are also provided,
<< Presentations`
leftTicks = CustomTicks[Identity, {-1, 1, 1, 5}];
rightTicks =
  CustomTicks[Log[10, #] &, {0, 2, {1, 2, 5}, {3, 4, 6, 7, 8, 9}},
   CTNumberFunction -> (Style[#, FontColor -> Blue] &)];
Draw2D[
  {Draw[f1[x], {x, 0, 2 \[Pi]}],
   Blue, Draw[Log[10, f2[x]], {x, 0, 2 \[Pi]}]},
  Frame -> True,
  FrameLabel -> {x, None, None, None},
  FrameTicks -> {{leftTicks, rightTicks}, {Automatic, Automatic}},
  PlotLabel -> Row[{f1[x], " and ", Style[f2[x], FontColor -> Blue]}],
  BaseStyle -> {FontSize -> 12},
  ImageSize -> 300]
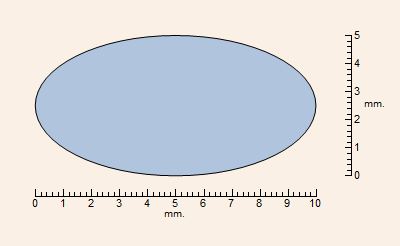
Here is a second example which can use any free standing linear scale.
Draw2D[
 {ColorData["Legacy"]["LightSteelBlue"], Disk[{0, 0}, {2, 1}],
  Black, Circle[{0, 0}, {2, 1}],

  XTickLine[{-2, 2, -1.3}, {0, 10}, {0, 10, 1}, 5,
   XNumberFunction -> (Style[#, 11, FontFamily -> "Helvetica"] &),
   XLabTickSpecs -> {0.032, 0},
   XUnLabTickSpecs -> {0.020, 0},
   XTextSpecs -> {{0, 1}, {1, 0}, 0.002}],

  YTickLine[{-1, 1, 2.5}, {0, 5}, {0, 5, 1}, 5,
   YNumberFunction -> (Style[#, 11, FontFamily -> "Helvetica"] &),
   YLabTickSpecs -> {0, 0.016},
   YUnLabTickSpecs -> {0, 0.010},
   YTextSpecs -> {{-1, 0}, {1, 0}, -0.01}],

  Text["mm.", {-0.00542015, -1.54438}],
  Text["mm.", {2.85, 0.0157696}]},

 AspectRatio -> Automatic,
 PlotRange -> {{-2.5, 3.2}, {-2, 1.5}},
 Background -> ColorData["Legacy"]["Linen"],
 ImageSize -> 400]