Message Boards Message Boards

0
|
6563 Views
|
3 Replies
|
1 Total Likes
View groups...
Share
Share this post:

Generate exact plots of this data?

Posted 8 years ago

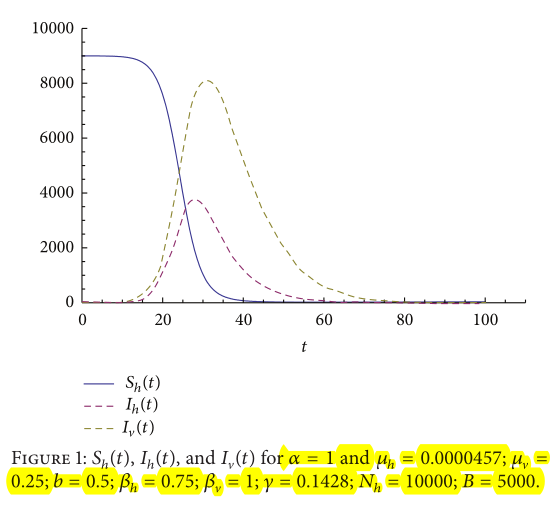
Hi, I'm having difficulties to plot the data exactly. I'm attaching the original plot and plots which are generated by mathematica. as you can see the difference between both of them. I really need help to draw exact plots. This is the exact plot enter image description here
and this is the plot generated by mathematica enter image description here
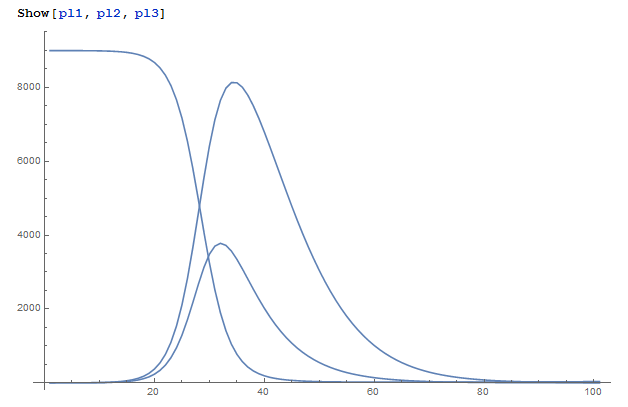
i'm attaching the notebook file as well. Could you please help me out? Regards

Attachments:
POSTED BY: Muhammad Afzal
3 Replies
Posted 8 years ago

Hi Muhammhad,

When I include plotmarkers, here is what I see:

enter image description here

Mathematica is producing a credible curve for the data points you have calculated. It may be that the original graph is not accurate, or that the points you have calculated are somehow different from those used to produce the original graph.

Kind regards, David

POSTED BY: David Keith
Posted 8 years ago

@Moderation Team- Please delete this post [answer] as the question was misinterpreted. Thanks.

POSTED BY: Girish Arabale
Posted 8 years ago

hi, Girish, i'm sorry i didn't mean the same appearance but i meant result wise. as you can see the original result: graph is way above at t=20 and at t=40 its touching the t-axis as well as you can notice from the original graph the same thing is happening at t=60 and t=80. Regards

POSTED BY: Muhammad Afzal
Reply to this discussion
Community posts can be styled and formatted using the Markdown syntax.
Reply Preview
Attachments
Remove
or Discard

Group Abstract Group Abstract