Hi, I'm having difficulties to plot the data exactly. I'm attaching the original plot and plots which are generated by mathematica. as you can see the difference between both of them. I really need help to draw exact plots. This is the exact plot 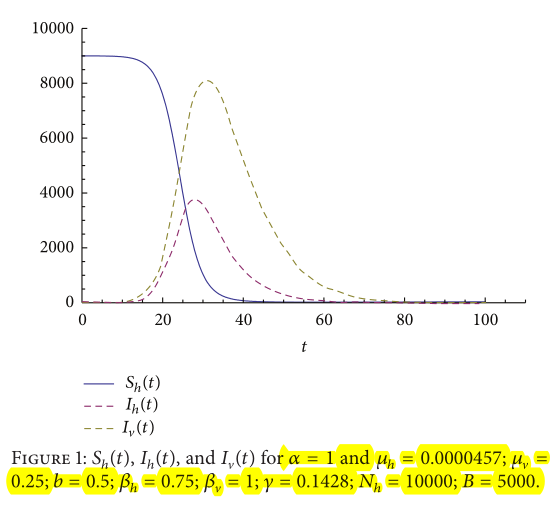
and this is the plot generated by mathematica 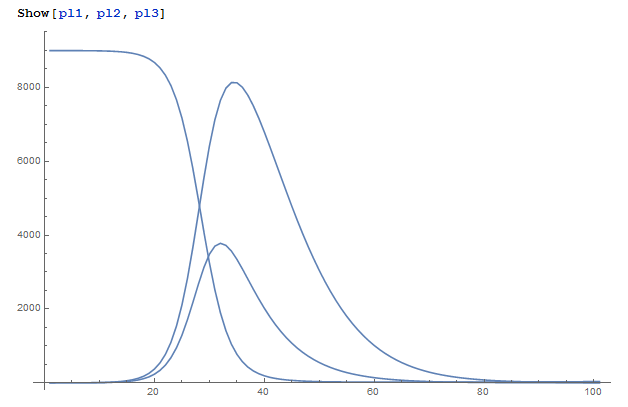
i'm attaching the notebook file as well. Could you please help me out? Regards
 Attachments:


