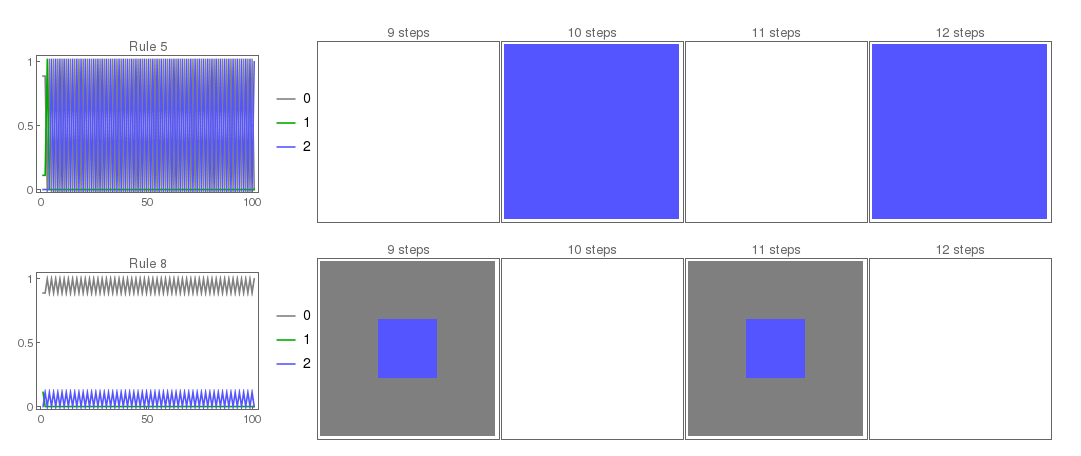
I found a way to quickly assess if a 3 color, 9 neighbors, totalistic CA shows interesting behavior or not. By making a plot of the percentages of states (0, 1, 2) as a function of the steps; these plots can be grouped on five categories that I've called: flat, oscillating, with spikes and curved (both filled and smooth). Flat and oscillating plots arise from CA that either converge to a state or have very short periodic behavior. Spikes and curved plots are found when the CA has nested behavior (for spikes) or a more "oriental rug" type evolution (curved); although not always I also observed that filled curved plot usually showed more interesting behavior.
The number of rules for this kind of CA is 3^19, so a quick way to assess whether a particular rule (or a set of them) is interesting is handy.
The function growthPlot takes a rule number and the number of times the rule should be applied. It returns a plot of the percentages of the three states of the CA as a function of the number of times that the rule has been applied.
growthPlot[k_Integer /; 0 <= k <= 3^19 - 1, t_Integer?NonNegative,  opts___] := Block[
  {initial = ConstantArray[0, {3, 3}], dt },
  initial[[2, 2]] = 1;
  dt = CellularAutomaton[{k, {3, {{1, 1, 1}, {1, 1, 1}, {1, 1, 1}}}, {1, 1}}, {initial, 1}, t];
  dt = (1/Length[#]^2 {Count[#, 0, {2}], Count[#, 1, {2}], Count[#, 2, {2}]}) & /@ dt;
  ListLinePlot[Transpose[dt], PlotStyle -> {Gray, Darker[Green], Lighter[Blue]}, PlotLegends -> {0, 1, 2}, opts]
  ]
I found that the CA can be classified according to the percentage of the states. Five different percentage-plots were found:
Flat plots like the one for rule 9, the CA associated with these plots reach an equilibrium state. 
Oscillating plots, they show two or the three states oscillating periodically, this is consistent with CA that have periodic behavior, like rule 8 or rule 5 
Spike plots are ones where there is no change in the plot but for non-periodic spikes, this usually indicates CA that display nested behavior like rule 3 or rule 42 
Smooth Curved Plots show CA where there is no steady state or oscillations. Examples are rule 732 or 39 
The last category is Filled Curved Plots, these are plots where the lines curve towards one another and they oscillate with very short wavelength, examples are rule 740 and rule 77936545 
Here is code for a manipulate that shows the growthplot and a CA side by side, controls for the rule number and the number of iterations
Manipulate[
    Row[{growthPlot[rule, iterations, PlotLabel -> "Rule " <> ToString[rule], ImagePadding -> All,  AxesLabel -> {"Time", "% of"}, Axes -> False, Frame -> True, ImageSize -> Scaled[.4], FrameTicks -> {{{0, .5, 1}, None}, {{0, 50, 100}, None}}],
    ArrayPlot[CellularAutomaton[{rule, {3, {{1, 1, 1}, {1, 1, 1}, {1, 1, 1}}}, {1, 1}}, {ini, 1}, {{{iterations}}}], ImageSize -> Scaled[.25], ColorRules -> {0 -> Gray, 1 -> Darker[Green],  2 -> Lighter[Blue]}]}],
    {rule, 0, 100, 1},
    {iterations, 0, 100, 1},
    SaveDefinitions -> True ]
The percentage-plots are a quick way to classify two-dimensional cellular automata with three colors, nine neighbors totalistic rules, a machine learning algorithm (or another scheme) could be used to do a systematic sorting of all rules (there are 3^19-1 different rules). The fact that the last 11000 rules all show the same static behavior should be explored. Also, I found periodic automata that oscillate between two states, it would be interesting to find an oscillation between three (or more) states.
So far I've looked at the percentage-plots of all rules labeled 0 to 770, then the last 11000 rules (from 3^19-1-11000 to 3^19-1) and an extra 200 random rules outside the previous intervals. I found that there are five different kinds of percentage-plots and that they are characteristic of certain behaviors of the CA. The last 11000 rules all gave flat percentage-plots. Of the remaining 930 rules, 319 showed interesting behavior (not fixed or oscillatory). Rule 42 shows nested evolution and should be thoroughly explored (it may hold the "Answer to the Ultimate Question of Life, the Universe, and Everything") , and rule 666 did not spawn demons or showed apocalyptic behavior when explored.