Wikipedia, constitutes the largest general reference website, holding over 5 million articles in English. Even when Wikipedia has a huge number of articles, the way that are categorized ( which is completely user base) make it hard to visualize all the content it has. Therefore it is interesting to seek for an automatize and efficient way of clustering the articles by their common topic.
To address this problem our first task was to obtain a random sample of Wikipedia Articles. For that we created a function that uses the Wikimedia API to get n random articles titles.
ClearAll[randomTitle]
randomTitle[n_] :=
Catch[Module[{url, json, res},
    url = URLBuild[
       {"https://en.wikipedia.org","w","api.php"},
       {"action"->"query","list"->"random","rnlimit"->n,"rnnamespace"->0,"format"->"json"}
    ];
    json = Import[url, "RawJSON"];
    If[!AssociationQ[json], Throw[$Failed]];
    res = Query["query", "random", All, "title"][json];
    If[MissingQ[res], Throw[$Failed], res]
]]
Now we create the next function that uses the produced titles and the Mathematica function WikipediaData, to calculate the links that take you into those articles and, the links that take you out to another articles. The parameter lvl tells the function how many times are we going to repeat the proces, once the first sample is generated. Max dictate the function how many links are we taking from each articles. The result of using this functions is having a list of rules between the initial articles and all the links that were generated after.
ClearAll[getLinks]
getLinks[name_String, lvl_Integer?Positive, max_Integer?Positive] := name ->
AssociationThread[
    {"Links", "ForwardLinks"},
    WikipediaData[name, #, "MaxLevel" -> lvl, "MaxLevelItems" -> max] & /@
       {"LinksRules", "BacklinksRules"}
]
getLinks[names_ /; VectorQ[names, StringQ], lvl_Integer?Positive, max_Integer?Positive] :=
AssociationThread[
    names,
    AssociationThread[
    {"Links", "BackLinks"},
    (*Apply[DirectedEdge, #, {2}]*) #] & /@ Transpose[WikipediaData[names, #, "MaxLevel" -> lvl, "MaxLevelItems" -> max] & /@
       {"LinksRules", "BacklinksRules"}]
]
Doing this process several times we manage to do a sample and now is trivial to generate a graph of this data. 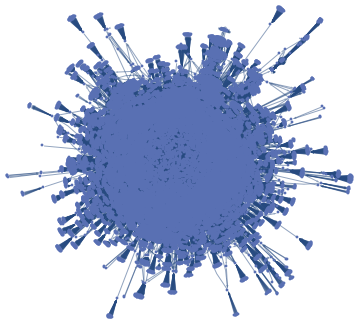
As you can see in the above graph is a mess and don't tell us a lot of information. So it's necessary to do further analysis. a analysis. The first step is to get more the centrality of each article this by using BetweennessCentrality function, and then get the n articles with more centrality. Once we have this information we can take a random central article and explore the articles that are connected from this center. In this case the article about the American Civil War.
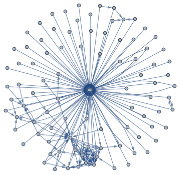
This is a more clear view of a specific article, but still we arise to a big problem. The fact that two Wikipedia articles share links doesn't means that they share the same topic.
So now we need to develop a way to check for the similarities between the "child" and "parent" articles. For this we start by getting the abstracts from all the articles in the subgraph.
neighbors[g_,step_,rnm_]:=Join[VertexInComponent[g,rnm,step],VertexOutComponent[g,rnm,step]]
neig= neighbors[g,1,rndomch]
asdasd = StringReplace[WikipediaData[#,"SummaryPlaintext"]&/@neig,
{"."->" ",","->" ","'"-> " ","-"->" ","\[LongDash]"-> " ","\""->" ","?"->" ","("->" ",")"->" ","{"->" ","}"->" ",":"->" ",";"->" ","&"->" ","\[Dash]"->" ","/"->" ","\[Degree]"->" ","$"-> " "}];
In the above code we take from the members of the subgraph their Wikipedia abstracts and remove every non letter character. We continue to do a clean up of the abstracts removing stop words, doing everything lowercase , and removing all non ASCII characters.
babab= ToLowerCase@StringSplit@DeleteStopwords@asdasd;
bababa =Select[PrintableASCIIQ][babab[[#]]]&/@Range[Length[babab]];
At this point we just have being cleaning the text, but how about the analysis ?
It turns up that to test if two text are related it's not a trivial task,there are several things that can affect the meaning of a sentence, semantics, synonyms etc. So what we used was a set of neural networks to classify text, named Word2Vec. This model was developed by a team of researchers by google.
Unfortunately Word2Vec is not natively supported by Mathematica. So what we did is to export the words from the articles, write a python script that reads and create via word2vec similarity measures. And then import it again to Mathematica, establish a threshold and modify the graph.
Export["ababa.dat",bababa[[1]],"CSV"]; (*Export the parent article*)
ln = Length[neig]-1
Table[Export["Data_"<>ToString[n-2]<>".dat",babab[[n]]],{n,2,ln+1}] (*Export the child articles*)
ncr =RunProcess[{"python.sh",ToString[ln]}]; (*Execute a bash scrips that runs the python script *)
Once that the python script has measure the similarities we can import them and start working with the graph outputs.
outs = ToExpression/@StringSplit[ncr[["StandardOutput"]]]//Prepend[1] (* We import the outputs and convert them to Numbers*)
pairs=Select[list,#[[2]]>0.6&]; (*Threshold *)
Subgraph[smallg,pairs[[All,1]],EdgeStyle->edgeWeight[pairs],VertexLabels->Placed[ "Name",Tooltip]]
Note that we used the similarity measures to filter out probably unrelated articles and modify the thickness of the links in function of the similarity measure.
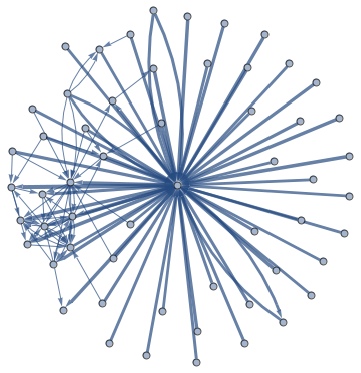
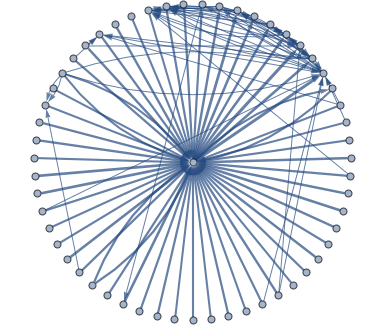
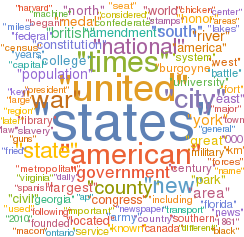
Basically once you have the similarity measure you can do a lot of different outputs, for example we can make a radial style plot or see the most common words in the articles.
