Let's say you have the sentence:
t2 = "The alcohol evaporated because the temperature was so high"
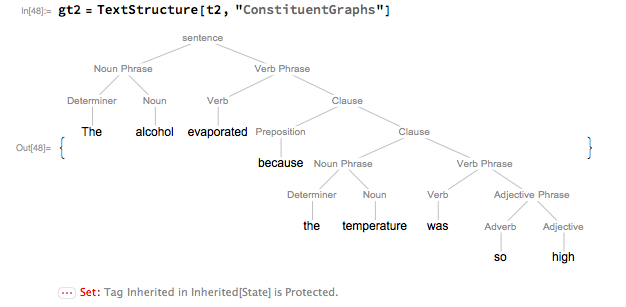
"TextStructure", an experimental function, provides a beautiful sentence constituent graph:
gt2 = TextStructure[t2,"ConstituentGraphs"]
However, gt2 is not a Graph: GraphQ[gt2] gives a "False" result. In order to have it as a graph, I have to manually select the graph and copy it as "Input Text".
My question is: how do I make this process of converting the picture to a graph using commands instead of manually?


