Message Boards Message Boards

0
|
4911 Views
|
1 Reply
|
3 Total Likes
View groups...
Share
Share this post:

Use ListPolarPlot to plot negative values?

Posted 8 years ago

I've got some data that represents pedal pressure for a cyclist. The shoe is clipped to the pedal, so he can push the pedal in the downstroke and pull it in the upstroke. The pull is expressed as a negative value, to distinguish from a push. I want to plot the force of one foot on the pedal around one full pedal stroke. I assume I should use ListPolarPlot. But this gives rise to the following problems:

  1. I can't seem to get the radial axis range to start at a negative number. I need to go from -150 to +250, not have "0 in the bullseye".
  2. I need degree tick markers around the perimeter of the plot. I can get these, but...
  3. I don't seem to be able to put 0 degrees at the top of the plot, where by convention it must be.
  4. By convention, the cyclist is seen facing right. So the degree markers need to run clockwise, not counter-clockwise.

I am not committed to ListPolarPlot, but I don't know of any other function I can use to plot this data.

Any suggestions?

POSTED BY: Brad Varey
Posted 8 years ago

In polar coordinates, the point $(-r,\theta)$ is the same as $(r,\theta+\pi)$, so you'll need to do a bit of shifting if you want negative radial values (though I would no longer term it polar coordinates).

Anyway:

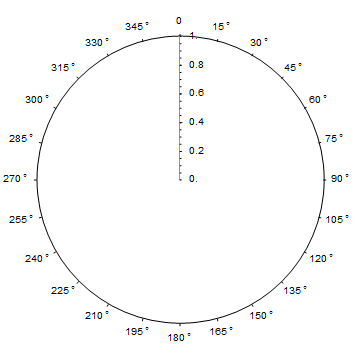
ListPolarPlot[{}, PolarAxes -> True, PolarAxesOrigin -> {?/2, 0},
              PolarTicks -> {{#, Mod[(?/2 - #)/?, 2] 180 °} & /@ Range[0, 2 ? - ?/12, ?/12], Automatic}]

adjusted polar ticks

POSTED BY: J. M.
Reply to this discussion
Community posts can be styled and formatted using the Markdown syntax.
Reply Preview
Attachments
Remove
or Discard

Group Abstract Group Abstract