At my article Squeezing Pi from a Menger Sponge, I introduced the Happy Pi fractal. I started with the Wallis formula.

And then I gave code there for alternately chopping and lengthening segments. After many steps, the total length of the segments would be equal to Pi.

Unfortunately, it gets pretty tricky to see what's going on with a fractal line. One way to get a better visualization of the fractal line is to map it to a space-filling curve of some sort. One of the simplest is the double spiral.
PolarPlot[{t, -t}, {t, 0, 10 Pi}, Axes -> False]

We can use that to map segments of the fractal line to arcs of the double spiral.
Show[PolarPlot[Sign[#[[1]]] t, {t, Abs[#[[1]]], Abs[#[[2]]]}, Axes -> False,
    PlotStyle -> {Black, Black}] & /@ ((Partition[Last[FoldList[fractionfractal[#1, #2] &, {0, 4},
         Table[((2 n + 1 - (-1)^n)/2)/((2 n + 1 + (-1)^n)/2), {n, 2, 16}]]], 2] - 2) 60 Pi)]

Not as enlightening as I was hoping it would be.
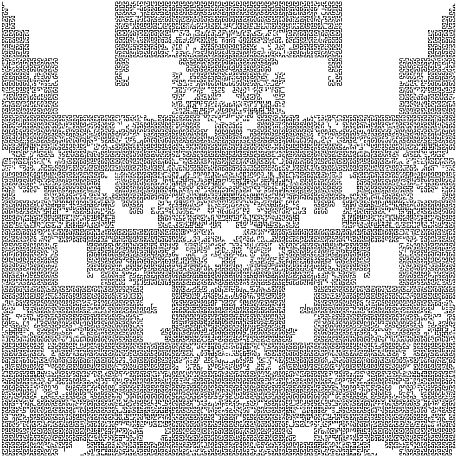
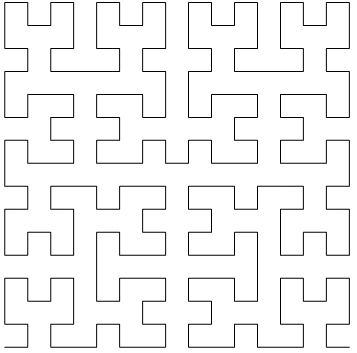
Another space-filling curve is shown at Hilbert and Moore Fractal Curves. Combining the Hilbert Curve and the fractal line yields something like the following.

A little bit of explanation for how that was made -- first I generated a Hilbert sequence.
hilbert={0,1,3,2,8,10,11,9,12,14,15,13,7,6,4,5,16,18,19,17,20,21,23,22,28,29,31,30,27,25,24,26,48,50,51,49,52,53,55,54,60,61,63,62,59,57,56,58,47,46,44,45,39,37,36,38,35,33,32,34,40,41,43,42,128,130,131,129,132,133,135,134,140,141,143,142,139,137,136,138,160,161,163,162,168,170,171,169,172,174,175,173,167,166,164,165,176,177,179,178,184,186,187,185,188,190,191,189,183,182,180,181,159,157,156,158,155,154,152,153,147,146,144,145,148,150,151,149,192,194,195,193,196,197,199,198,204,205,207,206,203,201,200,202,224,225,227,226,232,234,235,233,236,238,239,237,231,230,228,229,240,241,243,242,248,250,251,249,252,254,255,253,247,246,244,245,223,221,220,222,219,218,216,217,211,210,208,209,212,214,215,213,127,126,124,125,119,117,116,118,115,113,112,114,120,121,123,122,111,109,108,110,107,106,104,105,99,98,96,97,100,102,103,101,79,77,76,78,75,74,72,73,67,66,64,65,68,70,71,69,80,81,83,82,88,90,91,89,92,94,95,93,87,86,84,85};
Then I did the Z-order curve of the sequence. I combined the result with the fractal line, but I need better code than what I've got so far.
Graphics[Line[(FromDigits[#, 2] & /@ Reverse[Transpose[Partition[#, 2]]] & /@ IntegerDigits[hilbert, 2, 8])]]

It seems to me that there might be a fractal partial-space-filling curve related directly to the Wallis formula. Does anyone see a way to do that?
