Now that Mathematica 11 has been released, I thought I would create a new post about the project I worked on at the Wolfram Summer School, expanding on Reddit. ServiceConnect now works with Reddit's API, opening vast possibilities for social research and network visualizations.
When thinking about Reddit compared to Facebook or Twitter, analytical hurdles pop up. For example, mapping connections on Twitter is fairly easy. However, Reddit is mostly anonymous, and social characteristics of users, such as race, gender, age, are largely unidentifiable. Also, so much of Reddit is image based. So, I was very curious what the best way to approach so much data would be.
Helpfully, my mentor Bernat Espigule-Pons sent me some code to get started. When I looked at it, I was not quite sure at first what it was doing. (I am admittedly a Wolfram Language newbie). However, once I had a visualization to look at, I understood the natural language processing at work. Christian Pasquel was also helpful in explaining the API properties specific to Reddit.
Let's begin with the basics. First we use Mathematica's ServiceConnect function to pull requests from Reddit's API. An authentication window opens in a browser, and voila, you are connected via Mathematica 11.
reddit=ServiceConnect["Reddit"]
After we have defined our reddit object we can start to think about what sort of data we want to pull. Images would be fantastic to use with machine learning and neural networks, given the data on Reddit. However, I wanted to start with something a little more simple. So, we can think about text in comments and users. One part of Reddit where we know the identity of at least one user with some certainty happens during r/IamA or Ask Me Anything/AMA. We know who the person answering questions is. So let's look at Peter Dinklage's AMA. Does he "drink and know things" in real life? That is not the research question here, and it is curious, but let's show how we might use some Reddit data to make some cool visualizations.
First we need to pull comments from the AMA. The following code is not the most efficient but can show how this analysis is built.
AMAcomments =
  reddit["PostCommentsData",
   "Post" ->
    "https://www.reddit.com/r/IAmA/comments/22sber/i_am_peter_\
dinklage_you_probably_know_me_as/", MaxItems -> 500];
comments = AMAcomments["Comments"];
data = comments[
   All, {"Author", "Body", "Score", "CreationData", "Edited",
    "GlobalID"}];
So we now have our comment data and several fields to play around with. Since we are dealing with unstructured data/text, using Mathematica's natural language processing is an obvious choice to proceed. My mentor Bernat provided some code to help.
similarities =
  Flatten[Outer[Rule, {#},
      Nearest[DeleteCases[Normal[data[All, "Body"]], #], #]] & /@
    Normal[data[All, "Body"]]];
What is fantastic here is that in just a few lines of code, we are able to cluster similar language structures together. To visualize it, we can simply graph the similarities.
Graph[similarities]
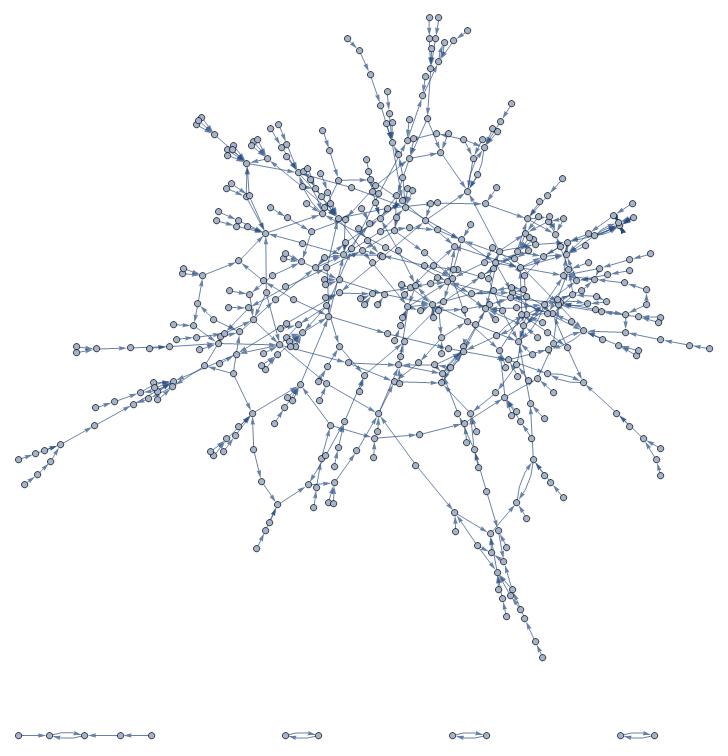
So, let's adjust vertex/node size to reflect comment popularity and eliminate directed edges.
g = Graph[similarities,
  VertexSize ->
   Normal[data[All, #["Body"] -> {"Scaled", #["Score"]/150000} &]],
  VertexLabels -> Placed["Name", Tooltip], DirectedEdges -> False,
  ImageSize -> Large]
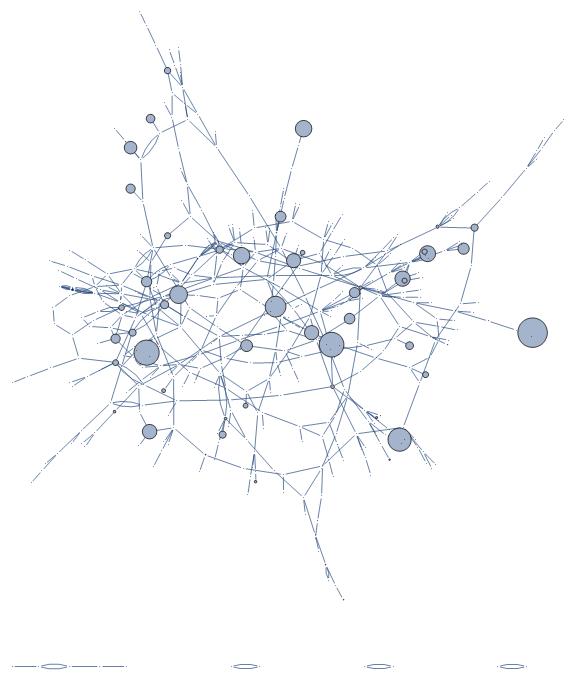
We can use the ToolTip function to better visualize the actual text of comments.
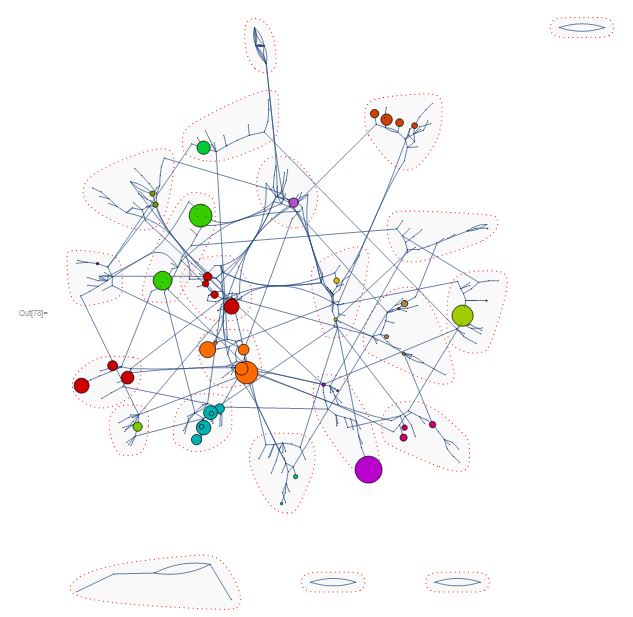
However, let's say we're more interested in clusters, or communities of comment structure. We can use CommunityGraphPlot to do so.
CommunityGraphPlot[#, FindGraphCommunities[#],
   CommunityRegionStyle -> Directive[Opacity[.05], Gray],
   CommunityBoundaryStyle -> Directive[Red, Dotted],
   Method -> "SpringElectrical", ImageSize -> Large] &@g
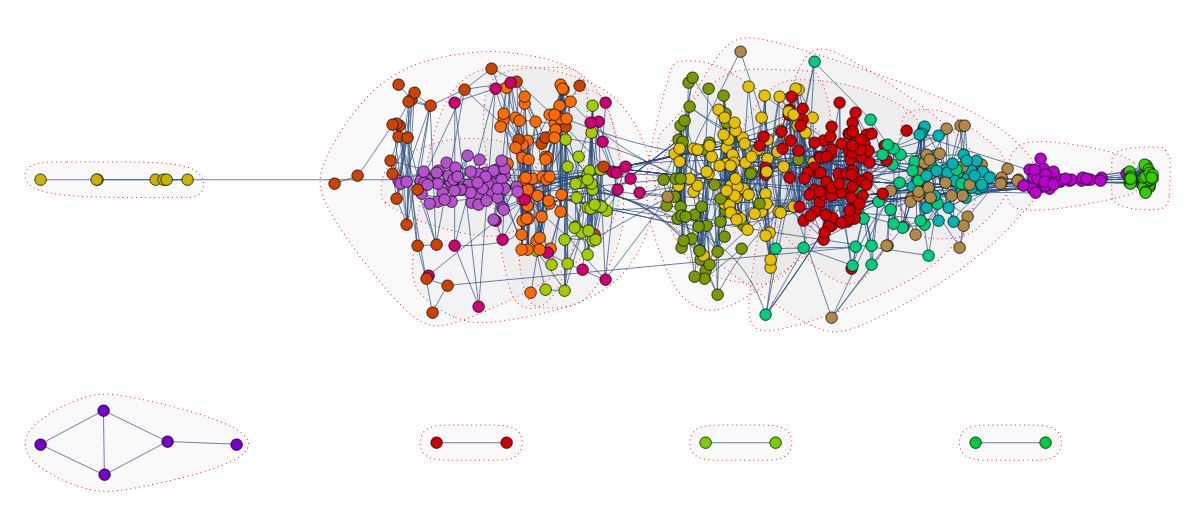
We can also use LinePlot to visualize comment structure.
CommunityGraphPlot[LineGraph[gSIM],
 CommunityRegionStyle -> Directive[Opacity[.05], Gray],
 CommunityBoundaryStyle -> Directive[Red, Dotted], ImageSize -> Full]
There are so many more possibilities, including image processing, sentiment and topic analysis, along with maybe testing some theories about social interaction and how they hold up in online communication environments.
I hope you find Reddit as interesting as I do and conduct your own analysis by sentiment, topic, or use image recognition to analyze the data that way in Mathematica. There are so many possibilities available with just a little bit of coding. Explore the documentation and see how you can analyze Reddit.


