I found similar questions to mine here, however the suggested answers are not what I need. I have a list of data in the polar angles, phi and theta, which I would like to plot on the surface of a sphere. My list records the rise and drop in a real physical property, and so for every (phi, theta) point I have a different radial distance. I think plotting the list on a sphere would show the peaks and troughs on its surface. I have tried all existing graphics functions but none of them produced what I need. Converting into xyz will show the list as points not as a surface. How can I do that in Mathematica?
Did you try ListSurfacePlot3D?
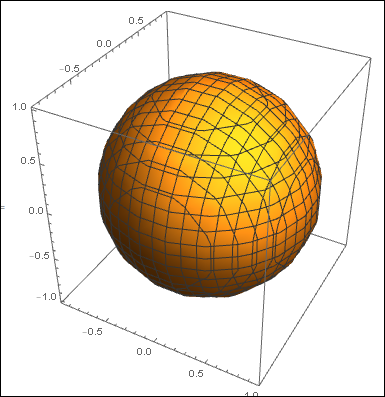
pointsOnSphere = FromSphericalCoordinates@
    Flatten[Table[{1, j, i}, {i, -\[Pi] + 0.2, \[Pi], 0.2}, {j, 0.2, \[Pi], 0.2}], 1];

ListSurfacePlot3D[pointsOnSphere]