Hi ,
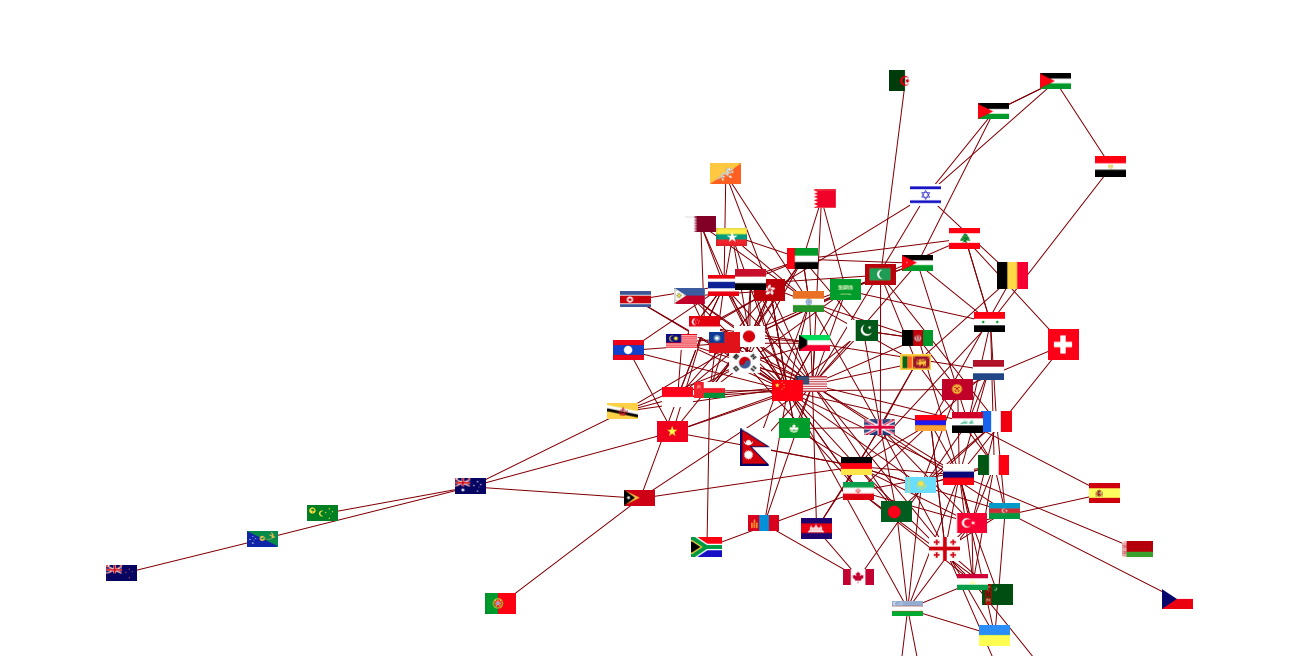
I am trying to map every country in a particular continent to its export partners and show it using graph and tree plot if possible . I want the graph show with its flags .Below is my code :
flags = Rule[#, CountryData[#, "Flag"]] & /@ CountryData[];
GraphPlot[ Flatten[Thread[# -> CountryData[#, "ExportPartners"]] & /@ CountryData["Asia"]], VertexRenderingFunction -> (Inset[ Show[#2 /. flags, ImageSize -> 30], #1] &), MultiedgeStyle -> False, VertexLabeling -> True]
the output is :

How can I use table to plot a grph for each country with its export partners and maybe the export products ?
Table[GraphPlot[ Flatten[Thread[# -> CountryData[#, "ExportPartners"]] & /@ m], VertexRenderingFunction -> (Inset[ Show[#2 /. flags, ImageSize -> 30], #1] &), MultiedgeStyle -> False, VertexLabeling -> True], {m, {countryData["Aisa"]}}]
I tried using table but its gives me error.
Please explain a little of the answer you provide , of how you implemented it .Thanks