Message Boards Message Boards

0
|
7625 Views
|
1 Reply
|
3 Total Likes
View groups...
Share
Share this post:

Graph Plot , Tree Plot , Table to map country data

Posted 11 years ago
Hi ,
I am trying to map every country in a particular continent to its export partners and show it using graph and tree plot if possible . I want the graph show with its flags .Below is my code :
flags = Rule[#, CountryData[#, "Flag"]] & /@ CountryData[];

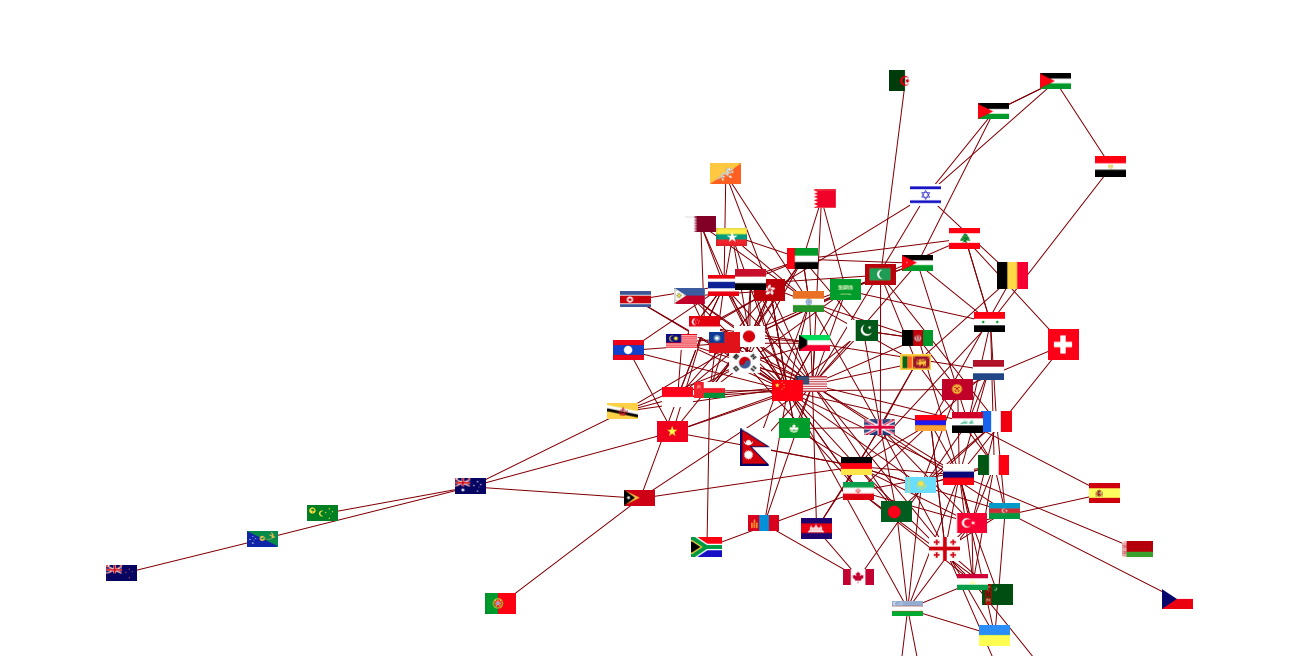
GraphPlot[ Flatten[Thread[# -> CountryData[#, "ExportPartners"]] & /@ CountryData["Asia"]], VertexRenderingFunction -> (Inset[ Show[#2 /. flags, ImageSize -> 30], #1] &), MultiedgeStyle -> False, VertexLabeling -> True]
 the output is :


How can I use table to plot a grph for each country with its export partners and maybe the export products ?
Table[GraphPlot[ Flatten[Thread[# -> CountryData[#, "ExportPartners"]] & /@ m], VertexRenderingFunction -> (Inset[ Show[#2 /. flags, ImageSize -> 30], #1] &), MultiedgeStyle -> False, VertexLabeling -> True], {m, {countryData["Aisa"]}}]
I tried using table but its gives me error.

Please explain a little of the answer you provide , of how you implemented it .Thanks
POSTED BY: nfaterpe
I think you were nearly there, just a slight rearrangement of the & /@  required so that the Graph function is applied to each m. I use Graph rather than GraphPlot, but the basics are the same, just the details differ.
Table[
   Labeled[
    Graph[
     Thread[# -> CountryData[#, "ExportPartners"]],
     VertexShapeFunction -> (Inset[
         Show[#2 /. flags, ImageSize -> 50], #1] &), ImageSize -> 400 ],
    Column[CountryData[#, "ExportCommodities"], Top]] & /@ m,
  {m, {CountryData["Asia"][[1 ;; 3]]}}]
- I've only done the first three here (it takes some time to download the data):

POSTED BY: C ormullion
Reply to this discussion
Community posts can be styled and formatted using the Markdown syntax.
Reply Preview
Attachments
Remove
or Discard

Group Abstract Group Abstract