Thanks Claude and Luca. That clears things up. So the actual (continuous) time of an egg hatching is only recorded by day. That means, for example, the 8 eggs recorded on day 9 hatched sometime between day 8 and day 9. To account for the fact that you have "censored" data one needs to construct the likelihood (or the log likelihood) a bit different than what one would do if there were continuous measurements.
Also, Mathematica has a built-in Erlang distribution as Claude has shown. However, Mathematica uses a slightly different parameterization that you use. But the conversion is simple: to use Mathematica's built-in Erlang distribution you would use
ErlangDistribution[k,k/d]
To construct the likelihood function so that maximum likelihood estimates of
$k$ and
$d$ could be obtained, you would use the following:

where
$G(x)$ is the cumulative distribution function of the Erlang distribution and
$f_i$ is the associated number of eggs counted on day
$i$. The Mathematica code is
data = {{8, 9}, {9, 12}, {10, 16}, {11, 20}, {12, 25}, {13, 30}, {14, 35}, {15, 39}, {16, 43}, {17, 47},
{18, 49}, {19, 51}, {20, 52}, {21, 51}, {22, 50}, {23, 48}, {24, 46}, {25, 43}, {26, 40}, {27, 36}, {28, 33},
{29, 29}, {30, 26}, {31, 22}, {32, 19}, {33, 17}, {34, 14}, {35, 12}, {36, 10}, {37, 8}};
n = 1000;
count = data[[All, 2]];

logLikelihood = count[[1]] Log[CDF[ErlangDistribution[k, k/d], 8]] +
  Sum[count[[i]] Log[(CDF[ErlangDistribution[k, k/d], i + 7] - CDF[ErlangDistribution[k, k/d], i + 6])], {i, 2, Length[data]}] +
  (n - Total[count]) Log[(1 - CDF[ErlangDistribution[k, k/d], 37])];

sol = NMaximize[{logLikelihood, d > 10 && k \[Element] Integers && k > 1}, {k, d}, MaxIterations -> 1000]
(* {-3308.429332485035`,{k -> 7,d -> 22.53458409510396}} *)
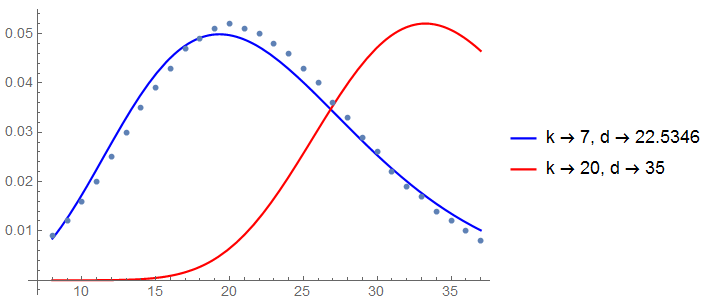
The maximum likelihood estimates do not match what you expect but let's plot the data and the fits with maximum likelihood estimates and the "expected" parameters.
Show[Plot[{PDF[ErlangDistribution[k, k/d] /. sol[[2]], x],
   PDF[ErlangDistribution[k, k/d] /. {k -> 20, d -> 35}, x]}, {x, 8, 37},
   PlotStyle -> {Blue, Red}, AxesOrigin -> {7, 0},
   PlotLegends -> {"k -> 7, d -> 22.5346", "k -> 20, d -> 35"}],
 ListPlot[Transpose[{data[[All, 1]], data[[All, 2]]/1000}]]]

So I think we're closer but not quite there yet as this doesn't match with your expected values for
$k$ and
$d$.