I don't want to wade too deeply into political waters here, but given how much of the national conversation lately has revolved around polarization in national political parties, I thought that others might be interested in exploring this dataset. If you haven't heard of it before, here's a Wikipedia summary:
In[2]:= WikipediaData["NOMINATE (scaling method)", "SummaryPlaintext" ]

Out[2]= "NOMINATE (an acronym for Nominal Three-Step Estimation) is a \
multidimensional scaling application developed by political \
scientists Keith T. Poole and Howard Rosenthal in the early 1980s to \
analyze preferential and choice data, such as legislative roll-call \
voting behavior. As computing capabilities grew, Poole and Rosenthal \
developed multiple iterations of their NOMINATE procedure: the \
original D-NOMINATE method, W-NOMINATE, and most recently DW-NOMINATE \
(for dynamic, weighted NOMINATE). In 2009, Poole and Rosenthal were \
named the first recipients of the Society for Political Methodology's \
Best Statistical Software Award for their development of NOMINATE, a \
recognition conferred to \"individual(s) for developing statistical \
software that makes a significant research contribution.\""
And here's the primary website for retrieving data and deeper explanations of methodology and use of the data:
http://voteview.com/dwnl.html
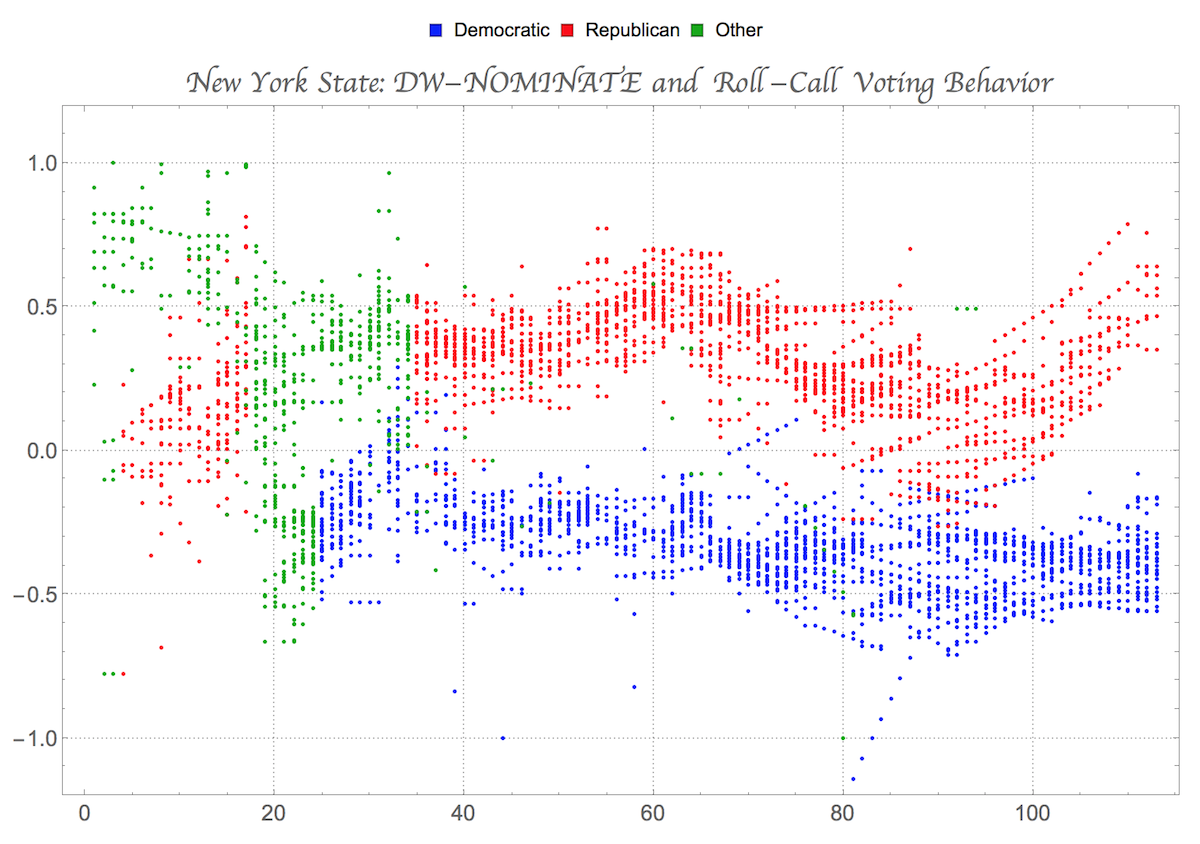
In the most simplistic terms, this dataset attempts to provide a quantitative measurement of where a legislator's roll-call voting behavior places them on the liberal-conservative spectrum (where positive values are more conservative, and negative are more liberal).
Some pre-curated data using "common space" DW-NOMINATE scores is available as a ResourceObject in the (beta) Wolfram Data Repository, so if you're using version 11 (or if you're using the Wolfram Development Platform) you can dive in and do some analysis very quickly.
data = ResourceData["DW-NOMINATE for US Congress"];
There's data available for everyone from the 1st through the 113th Congress, which obviously includes many political parties that aren't a factor anymore; I'll do one quick transformation since I want to focus on the Republican and Democratic parties, but lump everyone else into an "Other":
dataWithNames =
  Append[#, <|
      "PartyName" ->
       Switch[#PartyCode, 100, "Democratic", 200, "Republican",
        Except[100 | 200], "Other"]|>] & /@ data;
Now we can make a simple Manipulate that will plot values for legislators by state and over time:
states = EntityList[
   EntityClass["AdministrativeDivision", "AllUSStatesPlusDC"]];

Manipulate[
 ListPlot[GroupBy[
    Select[dataWithNames, #State ==
       state &], #PartyName &][{"Democratic", "Republican", "Other"},
   All, {"CongressNumber", "CoordDim1"}],
  PlotStyle -> {Blue, Red, Darker[Green]},
  PlotRange -> {-1.2, 1.2}], {state, states},
 ControlType -> PopupMenu]
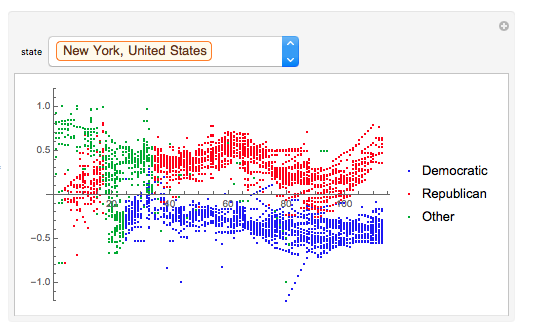
Or we could just as easily deploy this as an interactive form:
StatePlot[state_Entity] :=
 ListPlot[GroupBy[
    Select[dataWithNames, #State ==
       state &], #PartyName &][{"Democratic", "Republican", "Other"},
   All, {"CongressNumber", "CoordDim1"}],
  PlotStyle -> {Blue, Red, Darker[Green]}]

f = FormPage[{"State" -> "USState"}, Rasterize[StatePlot[#State]] &];

In[16]:= CloudDeploy[f, Permissions -> "Public"]
Out[16]= CloudObject["https://www.wolframcloud.com/objects/9b83db8f-\
c83c-40e8-b66f-d4d35d52ed61"]
So here's the final link: https://www.wolframcloud.com/objects/9b83db8f-c83c-40e8-b66f-d4d35d52ed61
I'm just going to put this all out without editorial comment, but there's obviously a lot more to explore with this data, and I hope this is enough to grab someone's interest and spark some more ideas.


