Inspired by a @Sander Huisman contribution on Wolfram Community: A short exploration of the featured contributors, I attempted a similar analysis of the Wolfram Demonstrations (titles, authors and publication dates). Here are some results and an attached notebook and a link to the data file. This is the number of Wolfram demonstrations as of October 30, 2016
In[1]:= numberOfDemos = ToExpression@
                Import["http://demonstrations.wolfram.com/new.html", "Data"][[1, -1,1]]

Out[1]= 10934
The demonstrations can be retrieved from the website http://demonstrations.wolfram.com in sets of 20 per page. This function creates a link to such a page:
demoRangeLink[start_, from_: "20060401", to_: "20161030"] :=
(*imports titles published between dates 'from' and 'to' starting from demo number 'start'*)
 StringTemplate["http://demonstrations.wolfram.com/new.html?query=published%3A%5B`\
from`%20TO%2020161030%5D&start=`start`&limit=20&sortmethod=recent"][<|
   "start" -> start, "from" -> from, "to" -> to|>]
This extracts all 10934 demonstration titles. Diacritics had to be removed and some 'oddities' as the German "ö"->"oe" in e.g "Möbius"->"Moebius" needed taken care of.
allDemosTitles =
 StringDelete[RemoveDiacritics[#], "'"] & /@ (Flatten[
      Table[(StringReplace[#, "ö" -> "oe"] & /@
         Import[demoRangeLink[i], "Data"][[3, 1]]), {i, 1,
        numberOfDemos - 20, 20}]]) //
   StringDelete[{"New today", "New this week", "New this month",
     "Updated this week", "Updated this month"}] // Flatten
With the title, we can now extract any demonstration from the website. But we first have to convert the title itself to a concatenated form as it appears inside the web address.
demoFilename[demoTitle_] := Module[{titl},
  titl = StringDelete[
    StringReplace[StringDelete[demoTitle, "'"],
     WordBoundary ~~ x_ :> ToUpperCase[x]], Except[WordCharacter]];
  StringTake[titl, {1, Min[60, StringLength[titl]]}]]
This shows how the titles appear inside the links:
In[409]:= allDemosTitles[[1234]]
demoFilename[%]
StringTemplate["http://demonstrations.wolfram.com/`x`/"][<|"x" -> %|>]

Out[409]= "Location Theory - Is the Bid Rent Curve Linear?"

Out[410]= "LocationTheoryIsTheBidRentCurveLinear"

Out[411]= \
"http://demonstrations.wolfram.com/\
LocationTheoryIsTheBidRentCurveLinear/"
We want, besides the title, also the demonstration author and publication date. We do this with the two functions extractAuthor & extractDate Publication dates were only added as of July 2007 i.e. for the most 4990 demonstrations. For the other 5944, we add "NA" as the date. Author names are found checking the first name string after "Contributed by: ". If multiple authors, only the first one is extracted. Dates are found using a DatePattern with StringCases
extractAuthor[title_] := Module[{ttl, link, string},
  ttl = demoFilename[title];
  link = StringTemplate["http://demonstrations.wolfram.com/`x`/"];
  string = Quiet@
    Cases[Import[link[<|"x" -> ttl|>],
       "Data"], {_?(StringMatchQ[#,
           "Contributed by: " ~~ __] &), ___}, \[Infinity]][[1, 1]];
  First[DeleteCases[#, ""] & //@
    StringTrim /@
     StringSplit[
      StringDelete[
       string, {"Contributed by: ", " (" ~~ ___ ~~ ")"}], {" and ",
       ","}]]]
extractDate[title_] := Module[{ttl, link, string},
  ttl = demoFilename[title];
  link = StringTemplate["http://demonstrations.wolfram.com/`x`/"];
  string = Import[link[<|"x" -> ttl|>], "Plaintext"];
  Last[StringCases[string,
     DatePattern[{"MonthName", " ", "Day", ", ",
       "Year"}]]] /. _StringTake -> "NA"[]]
We are now ready to make a dataset of our demonstration data : We create a table of 10934 rows {number, title, author, date} and convert it using Dataset:
makeDataRow[
  i_Integer] :=(*make one row per demonstration: {nr, title, author, \
date}*)
 Quiet@
  Prepend[Through[{# &, extractAuthor, extractDate}[
     allDemosTitles[[i]]]], i]
makeDataList[start_Integer, stop_Integer] :=

 ParallelMap[makeDataRow, Range[start, stop]]


allDemosDataList =
  makeDataList[1,
   10922];(*this took about 10 hours(! )overnight since the demos \
website is not very fast, so we saved it in the linked DropBox file \
"allDemosDatalist.CSV" at:
https://www.dropbox.com/s/d9ub1jitvjtmsso/allDemosDatalist.CSV?dl=0*)

allDemosDataset =
 Dataset[Association /@ (Thread[
       Rule[{"number", "title", "author", "date"}, #]] & /@
     allDemosDataList)]
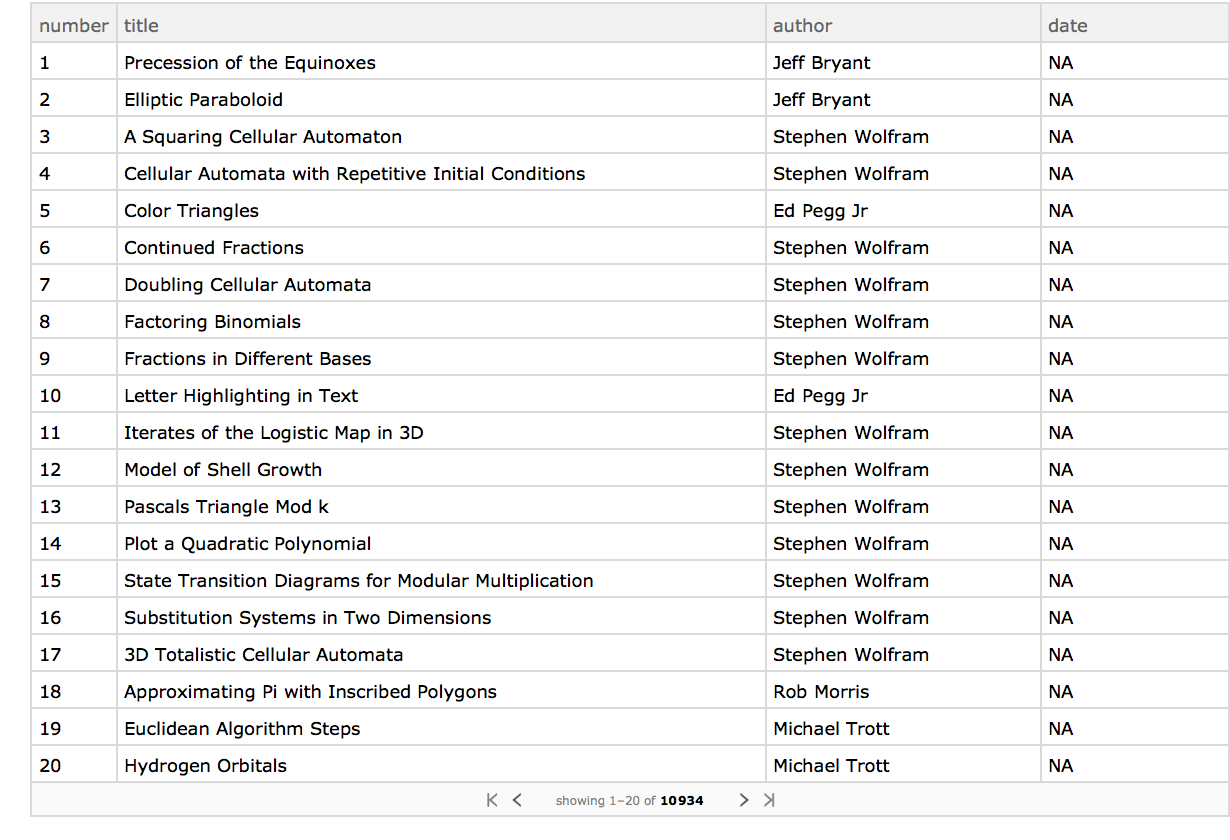
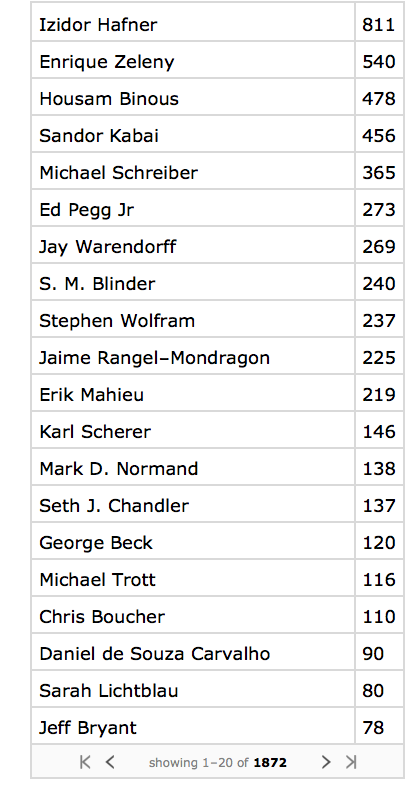
Starting with this allDemosDataset, we can now do some interesting analysis. Here are some examples: A tally of the number of demonstrations per author:
tallyAuthors =
 allDemosDataset[Reverse[SortBy[Tally[#], Last]] &, "author"]
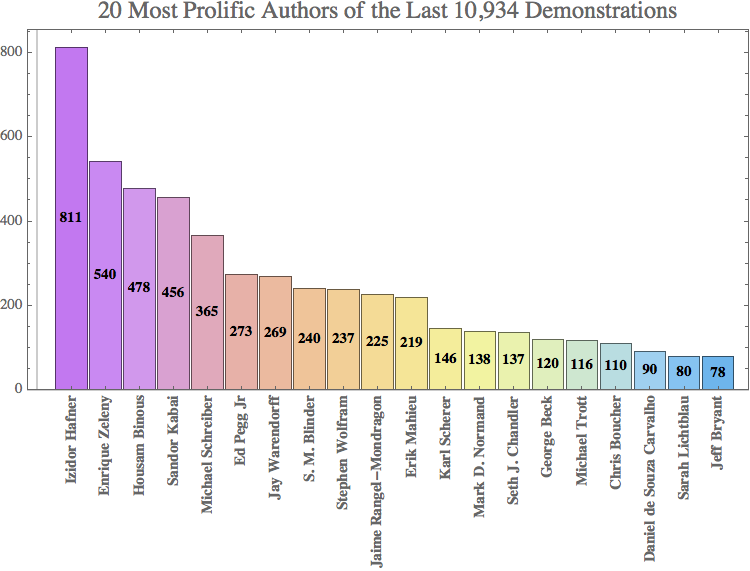
A plot of the 20 most prolific ones:
    BarChart[Normal[tallyAuthors][[All, 2]][[;; 20]],
     ChartLabels ->
      Placed[Style[#, Bold] & /@ Normal[tallyAuthors][[All, 1]][[;; 20]],
       Axis, Rotate[#, 90 \[Degree]] &], ChartStyle -> "Pastel",
     LabelingFunction -> (Placed[Style[ToString[#], Bold], Center] &),
     PlotLabel ->
      Style["20 Most Prolific Authors of the Last 10,934 Demonstrations",
       16], PlotTheme -> "Scientific", AspectRatio -> .5,
     ImageSize -> 500]
There are 1872 different demonstration authors. They write an average of 5.84 demonstrations each:
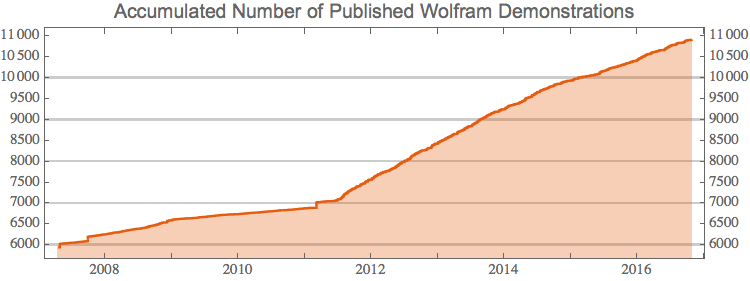
A plot of the evolution of the number of demonstrations since July 2007
    pubDates = Drop[DateList /@ pubDates // Sort, 11];
    DateListPlot[
     Transpose[{pubDates, Range[Length[pubDates]]}] /. {dt_, n_} :> {dt,
        n + 5944(*no of demos wo date*)}, Filling -> Axis,
     PlotTheme -> "Scientific",
     PlotLabel ->
      Style["Accumulated Number of Published Wolfram Demonstrations",
       FontFamily -> "Arial", 13], GridLines -> {None, Automatic},
     FrameTicks -> {Automatic, Range[0, 11000, 500]}, AspectRatio -> .35,
     ImageSize -> 500]
We finally look at word appearances in the titles. We make word-clouds of the 50 most frequently used nouns and verbs in the titles: "Using", "Comparing" or "Dissecting of "Functions" or"Equations" seem very popular in demonstrations.
    {allWords, allNouns, allVerbs} =
      DeleteStopwords@
         Flatten[StringSplit /@
           TextCases[
            Normal[allDemosDataset[All, "title"]], #]] & /@ {"Word",
        "Noun", "Verb"};
    {tallyWords, tallyNouns, tallyVerbs} =
      Take[Reverse@
          SortBy[{#[[1]], Length@#} & /@
            Quiet@GatherBy[#, Pluralize[#] &], Last], 50] & /@ {allWords,
        allNouns, allVerbs};
    GraphicsRow[
     WordCloud[#, Disk[{0, 0}, {1, .6}], ScalingFunctions -> Log,
        PlotLabel -> #, ImageSize -> 300] & /@ {tallyNouns, tallyVerbs}]

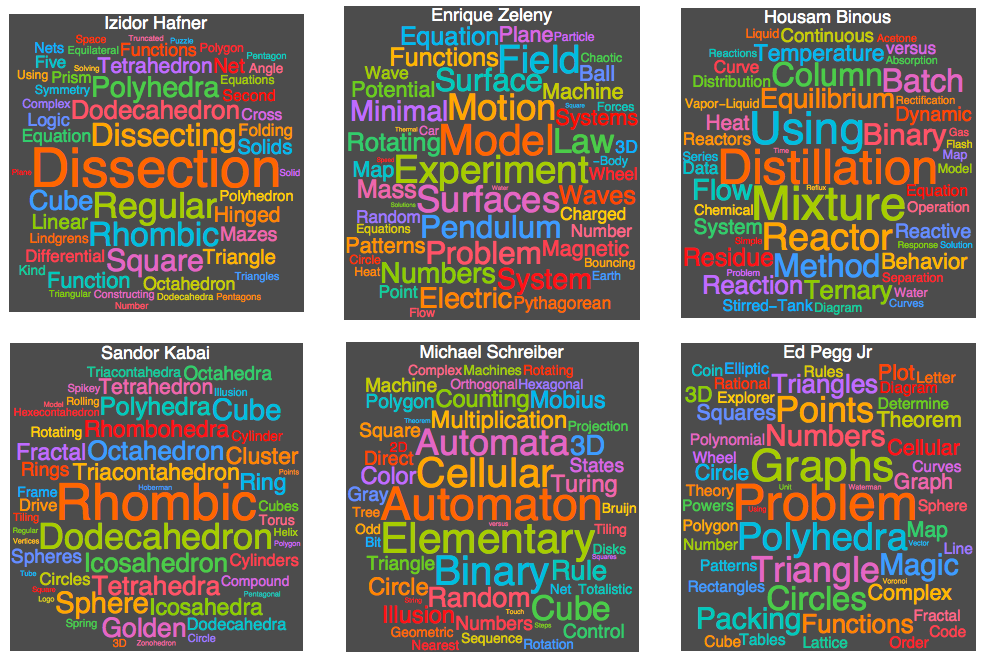
A word - cloud per author is equally possible. This is the word frequency for the 6 most prolific authors.
    Partition[
      WordCloud[mostProlificWords[#, 50], ScalingFunctions -> Log,
         PlotTheme -> "Marketing", PlotLabel -> Style[#, White],
         ImageSize -> 200] & /@ mostProlificAuthors, 3] // GraphicsGrid
Please give your comments or suggest improvements or more things that can be done.... The data file "allDemosDatalist.CSV" is attached to this post below and also available at the DropBox link.
 Attachments: