Group Abstract Group Abstract

Message Boards Message Boards

0
|
6.3K Views
|
7 Replies
|
0 Total Likes
View groups...
Share
Share this post:

Avoid different results while using ListPlot and DiscretePlot?

Posted 9 years ago

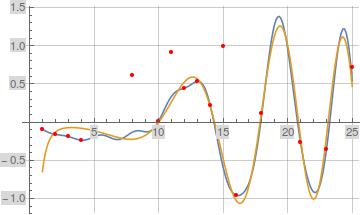
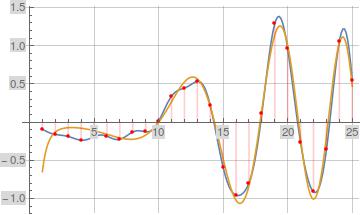
When I use DiscretePlot I get correct results (see first plot below), but when I use ListPlot I get incorrect results (see second plot below). Note when using ListPlot, some of the discrete points are totally missing (perhaps because they're evaluating outside of the displayed plot range), and others have an incorrect value.

Show[Plot[{Im[dOfZetaAltOpt[1/2 + I x, 1/2, 10, 10]], 
   Im[Zeta'[1/2 + I x]]}, {x, 1, 25}, PlotRange -> Automatic, 
  GridLines -> Automatic, PlotPoints -> 200, MaxRecursion -> 0], 
 DiscretePlot[Im[dOfZetaAlt2Opt[1/2 + I x, 1/2, 10, 10]], {x, 1, 25}, 
  PlotStyle -> {Red}]]  

DiscretePlot Invocation

Show[Plot[{Im[dOfZetaAltOpt[1/2 + I x, 1/2, 10, 10]], 
   Im[Zeta'[1/2 + I x]]}, {x, 1, 25}, PlotRange -> Automatic, 
  GridLines -> Automatic, PlotPoints -> 200, MaxRecursion -> 0], 
 ListPlot[Table[{x, Im[dOfZetaAlt2Opt[1/2 + I x, 1/2, 10, 10]]}, {x, 
    1, 25}], PlotStyle -> {Red}]]  

ListPlot Invocation

POSTED BY: Steven Clark
7 Replies
Anonymous User
Anonymous User
Posted 9 years ago

i get the same plot for both, and unsure about your special function i don't have

i will say: use Module to protect your variables from Global`

for instance, if Graphicsx exists and you assume Globalx doesn't refer to it: you might be wrong. in the case of "x" your safe.

however, if you've loaded packages or been trashing Global`, it may well trick you, tricks everyone at times

use Module[]

Context[]

see what your current context in

f[x_]=x=2; f[x_]=(Unprotect[x];x=2);

make sure your function doesn't try to access in-accessible variables as well, for example if your special function changes x but x is it's parameter, it changes $x???, not Global`x, unless you Unprotect x. i'm unsure how savvy you are about namespace so i mentioned it

?Global`*

see list of all variables in Global` , use ?? to see definitions

Attachments:
POSTED BY: Anonymous User
Posted 9 years ago

I've used this form of a Show statement which combines a Plot with a ListPlot successfully with the invocation of other simpler functions, and I suspect the complexity of the particular functions being invoked here is exposing a bug in the Mathematica implementation. The function being invoked shouldn't matter. I shouldn't get a different result when using ListPlot than I do when using DiscretePlot. I modified the Show statement with an invocation of N[] around the dOfZetaAlt2Opt function as follows and now I get the correct results, so perhaps Mathematica is getting confused while trying to keep track of too many exact results.

Show[Plot[{Im[dOfZetaAltOpt[1/2 + I x, 1/2, 10, 10]], 
   Im[Zeta'[1/2 + I x]]}, {x, 1, 25}, PlotRange -> Automatic, 
  GridLines -> Automatic, PlotPoints -> 200, MaxRecursion -> 0], 
 ListPlot[Table[{x, 
    N[Im[dOfZetaAlt2Opt[1/2 + I x, 1/2, 10, 10]]]}, {x, 1, 25}], 
  PlotStyle -> {Red}]]
POSTED BY: Steven Clark

Without specifying your function we can only guess... It might compile your function before evaluating, which can lead to trouble. It can do symbolic preprocessing on it, but assumes something, somehow, it could ...... Bottom line: without code, we can't help.

POSTED BY: Sander Huisman
Posted 9 years ago

Sander: Thanks for taking the time to review and respond to my question, but I no longer need help at this time since encapsulation with $N()$ provides a satisfactory workaround for the problem. If you're interested in the general topic of prime counting functions, you might be interested in some of the results which I've illustrated on the following website.
Fourier Series Representations of Prime Counting Functions

POSTED BY: Steven Clark

dOfZetaAlt2Opt ?

POSTED BY: Sander Huisman
Posted 9 years ago

dOfZetaAltOpt and dOfZetaAlt2Opt are two formulas which I've derived for the first-order derivative $\zeta'(s)$ of the Riemann zeta function. The dOfZetaAltOpt formula evaluates much faster and is displayed as the blue curve. Since the dOfZetaAlt2Opt function evaluates much slower, I was attempting to use DiscretePlot and ListPlot to confirm that it evaluates equivalently to the dOfZetaAltOpt function displayed in the blue curve. Both functions are a series of terms. The terms associated with the dOfZetaAltOpt function include invocations of Log, ExpIntegralE, and MeijerG functions. The terms associated with the dOfZetaAlt2Opt function include invocations of Log, ExpIntegralE, Gamma, and HypergeometricPFQ functions. I believe there must be some bugs in the Mathematica implementation which are the source of my problems. This question is related to another one of my questions.
How do I Simplify HypergeometricPFQ and MeijerG Sums?

POSTED BY: Steven Clark

I mean, we can't really give you much advice without knowing the functions:

Show[
 {
  DiscretePlot[Sin[x], {x, 1, 25}, PlotStyle -> {Red}],
  ListPlot[Table[{x, Sin[x]}, {x, 1, 25}], PlotStyle -> {Blue}, 
   Filling -> Axis]
  }
 ]

just works fine (V11). Always try to minimize your problem; i.e. give us only the 'core' of your code that gives a 'problem'.

POSTED BY: Sander Huisman
Reply to this discussion
Community posts can be styled and formatted using the Markdown syntax.
Reply Preview
Attachments
Remove
or Discard