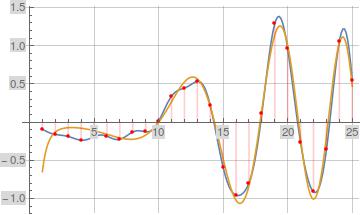
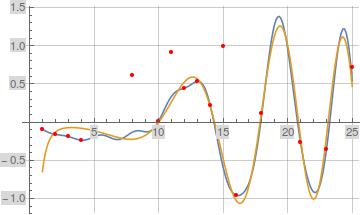
When I use DiscretePlot I get correct results (see first plot below), but when I use ListPlot I get incorrect results (see second plot below). Note when using ListPlot, some of the discrete points are totally missing (perhaps because they're evaluating outside of the displayed plot range), and others have an incorrect value.
Show[Plot[{Im[dOfZetaAltOpt[1/2 + I x, 1/2, 10, 10]],
   Im[Zeta'[1/2 + I x]]}, {x, 1, 25}, PlotRange -> Automatic,
  GridLines -> Automatic, PlotPoints -> 200, MaxRecursion -> 0],
 DiscretePlot[Im[dOfZetaAlt2Opt[1/2 + I x, 1/2, 10, 10]], {x, 1, 25},
  PlotStyle -> {Red}]]

Show[Plot[{Im[dOfZetaAltOpt[1/2 + I x, 1/2, 10, 10]],
   Im[Zeta'[1/2 + I x]]}, {x, 1, 25}, PlotRange -> Automatic,
  GridLines -> Automatic, PlotPoints -> 200, MaxRecursion -> 0],
 ListPlot[Table[{x, Im[dOfZetaAlt2Opt[1/2 + I x, 1/2, 10, 10]]}, {x,
    1, 25}], PlotStyle -> {Red}]]
