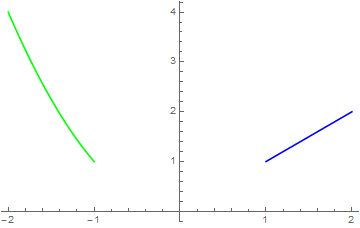
How about
  f[x_] := x
  g[x_] := x^2
  a[x_] := Piecewise[{{x^3, x < 0}, {1/x, x > 0}}]
  b[x_] := Piecewise[{{Sin[10*x]/x, x < 0}, {1, x == 0}}, Cos[10*x]]

  Show[{Plot[f[x], {x, 1, 2}, PlotStyle -> Blue], Plot[g[x], {x, -2, -1}, PlotStyle -> Green]}, PlotRange -> All,
  AxesOrigin -> {0, 0}]
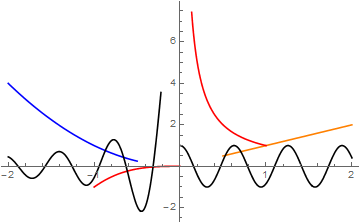
Or more complex.
   Show[{Plot[f[x], {x, 1/2, 2}, PlotStyle -> Orange],
   Plot[g[x], {x, -2, -1/2}, PlotStyle -> Blue],
   Plot[a[x], {x, -1, 1}, PlotStyle -> Red],
   Plot[b[x], {x, -2, 2}, PlotStyle -> Black]}, PlotRange -> All,
   AxesOrigin -> {0, 0}]