If you want to do some programming with US electoral votes, you will need to start with the basic state-to-electoral vote data.
In this cloud notebook, I show how you can import this data and work with it: http://www.wolframcloud.com/objects/jfklein/elections2016/electoral-votes-2016.nb
The basic data can be imported here:
data = Import[
  "http://www.infoplease.com/us/government/electoral-college-votes-state-elections.html", "Data"]
The data includes some headers and other things, so I use Position to find a state name, tweak the position to include all the states data, and then turn it into a list of Rules:
$electoralVotes = Rule @@@ Extract[data, Most[Most[First[Position[data, "Alabama"]]]]]
The results should look like this:
{"Alabama" -> 9, "Alaska" -> 3, "Arizona" -> 11, "Arkansas" -> 6,
"California" -> 55, "Colorado" -> 9, "Connecticut" -> 7, "Delaware" -> 3, "District of Columbia" -> 3, "Florida" -> 29, "Georgia" -> 16, "Hawaii" -> 4, "Idaho" -> 4, "Illinois" -> 20, "Indiana" -> 11, "Iowa" -> 6, "Kansas" -> 6, "Kentucky" -> 8, "Louisiana" -> 8, "Maine" -> 4, "Maryland" -> 10, "Massachusetts" -> 11, "Michigan" -> 16, "Minnesota" -> 10, "Mississippi" -> 6, "Missouri" -> 10, "Montana" -> 3, "Nebraska" -> 5, "Nevada" -> 6, "New Hampshire" -> 4, "New Jersey" -> 14, "New Mexico" -> 5, "New York" -> 29, "North Carolina" -> 15, "North Dakota" -> 3, "Ohio" -> 18, "Oklahoma" -> 7, "Oregon" -> 7, "Pennsylvania" -> 20, "Rhode Island" -> 4, "South Carolina" -> 9, "South Dakota" -> 3, "Tennessee" -> 11, "Texas" -> 38, "Utah" -> 6, "Vermont" -> 3, "Virginia" -> 13, "Washington" -> 12, "West Virginia" -> 5, "Wisconsin" -> 10, "Wyoming" -> 3}
You can load this list of rules into your own session:
CloudGet[CloudObject["https://www.wolframcloud.com/objects/jfklein/elections-2016/electoral-votes.m"]]
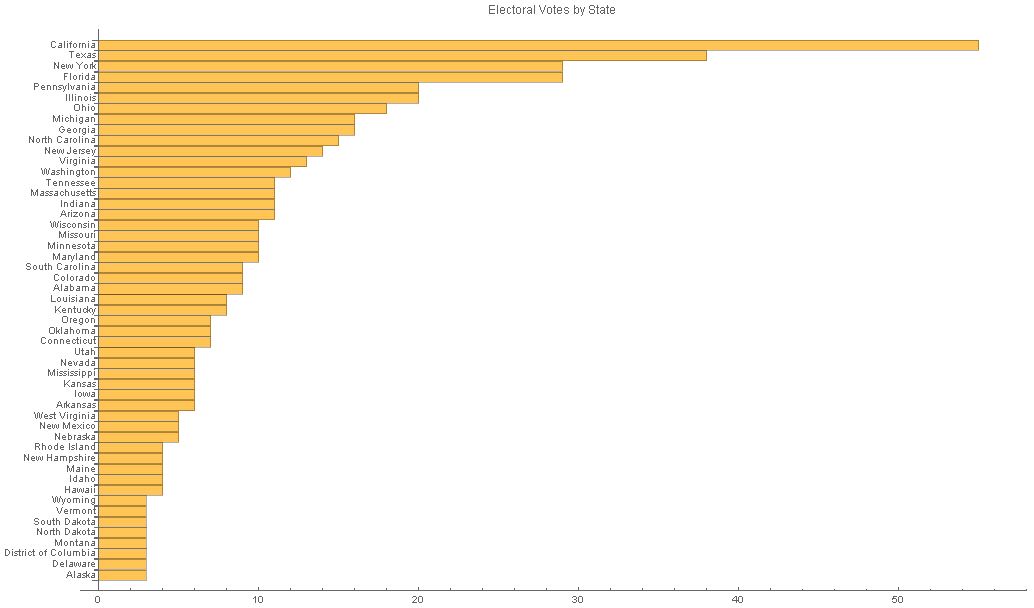
Once you have this basic data, you can do interesting things with it. This visualizes the states with their electoral vote weight:
sortedevotes = SortBy[evotes, Last];
BarChart[Values[sortedevotes], BarOrigin -> Left, ChartLabels -> Keys[sortedevotes],
  PlotLabel -> "Electoral Votes by State", ImageSize -> 1024]
We can also calculate how to win the election with the smallest number of states, which is the collection of the first of the biggest states to add to 270 votes or more.
TableForm[biggestStatesTo270 = TakeWhile[Reverse[sortedevotes],
    Total[Drop[Values[sortedevotes],
            First@FirstPosition[sortedevotes, #] - 1]] <= 270 &]]
This shows you can win the presidency by converting just 11 of the largest states:
California -> 55
Texas -> 38
New York -> 29
Florida -> 29
Pennsylvania->20
Illinois->20
Ohio->18
Michigan->16
Georgia->16
North Carolina->15
New Jersey->14


