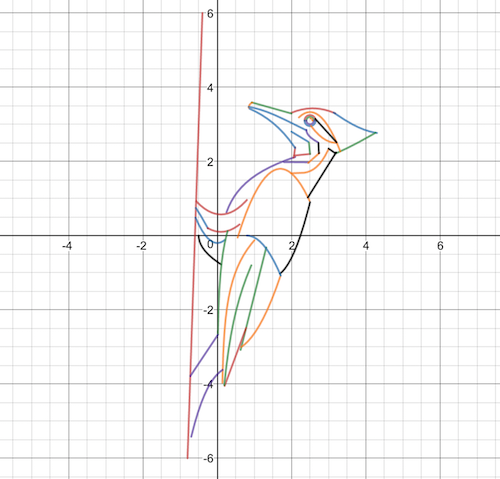
I am doing a project for school. I have successfully created three images, but on the final one for some reason the image is basically squished. There isn't anything wrong with my syntax (that I know of) but any suggestions would be greatly appreciated! I've attached two images: the woodpecker that I'm having issues with and a hummingbird that I completed.
Also, I originally used Desmos to design the images so here is what the Woodpecker should look like.
https://www.desmos.com/calculator/bempx6qwaj

CODE:
Show[{Plot[30 (x + .6), {x, -.8, -.4}],
  Plot[.7 Sin[x - 1] + 2.68, {x, 2, 3.18}],
  Plot[.7 Sin[x + .2] + 3.45, {x, 3.141, 4.3}],
  Plot[.07 x^2 + 1.5, {x, 3.2, 4.262}],
  Plot[.7 Log[x] + 1.6, {x, .25, 2.1}],
  Plot[-1.4 (x - 1.7)^2 + 1.8, {x, .55, 2.485}],
  Plot[Log[x - .12], {x, .139, 1}],
  Plot[Sqrt[.022 - (x - 2.5)^2] + 3.1, {x, 0, 5}],
  Plot[-Sqrt[.022 - (x - 2.5)^2] + 3.1, {x, 0, 5}],
  Plot[Sqrt[.01 - (x - 2.5)^2] + 3.1, {x, 0, 5}],
  Plot[-Sqrt[.01 - (x - 2.5)^2] + 3.1, {x, 0, 5}],
  Plot[Sqrt[.004 - (x - 2.5)^2] + 3.1, {x, 2.51, 2.7}],
  Plot[1.6 (x - 1.8), {x, 2.443, 3.2}],
  Plot[7 (x - 1.76), {x, 2.06, 2.1}],
  Plot[-.5 E^(x - 1) + 3.86, {x, .87, 2.097}],
  Plot[-.28 x + 3.85, {x, .93, 2}],
  Plot[-.01 x + 2, {x, 1.8, 2.46}],
  Plot[.89 (x - .25), {x, 2.45, 2.75}],
  Plot[-20 (x - 2.85), {x, 2.725, 2.739}],
  Plot[-1.6 (x - 2.5)^2 + 3.33, {x, 2.2, 3.314}],
  Plot[-2 ArcTan[x] - .3, {x, -.575, -.25}],
  Plot[4 (x - 1.4), {x, .63, 1.32}],
  Plot[1.1 (x - .35)^2 - 3.1, {x, .65, 1.7}],
  Plot[2 (x - 1.5)^2 - 1.1, {x, 1.69, 2.5}],
  Plot[2.7 (x - 1.7), {x, .2, .777}],
  Plot[-1.3 (x - .8)^2, {x, .8, 1.71}],
  Plot[2 Tan[x - 1.3], {x, .19, .92}],
  Plot[.7 (x - .7)^3 - 3.5, {x, -.7, .147}],
  Plot[Sqrt[.02 - (x - .99)^2] + 3.45, {x, 0, .947}],
  Plot[-Sqrt[x + .5], {x, -1, .1}],
  Plot[.8 (x - .1)^2 + .1, {x, -.256, .6}],
  Plot[.5 Cos[x - .5] + 3, {x, .85, 2.4}],
  Plot[.8 (x - .1)^2 + .57, {x, -.569, .8}],
  Plot[2 x^2 - .2, {x, -.584, .2}],
  Plot[Log[x] + 1.4, {x, .017, .28}],
  Plot[1.5 x - 2.7, {x, -.726, .017}],
  Plot[.9 (x - 2.1)^3 + 1.68, {x, 1.994, 3}],
  Plot[-.7 (x - 6.35), {x, 3, 3.185}]}, PlotRange -> All,
 AxesOrigin -> {0, 0}]
 Attachments: