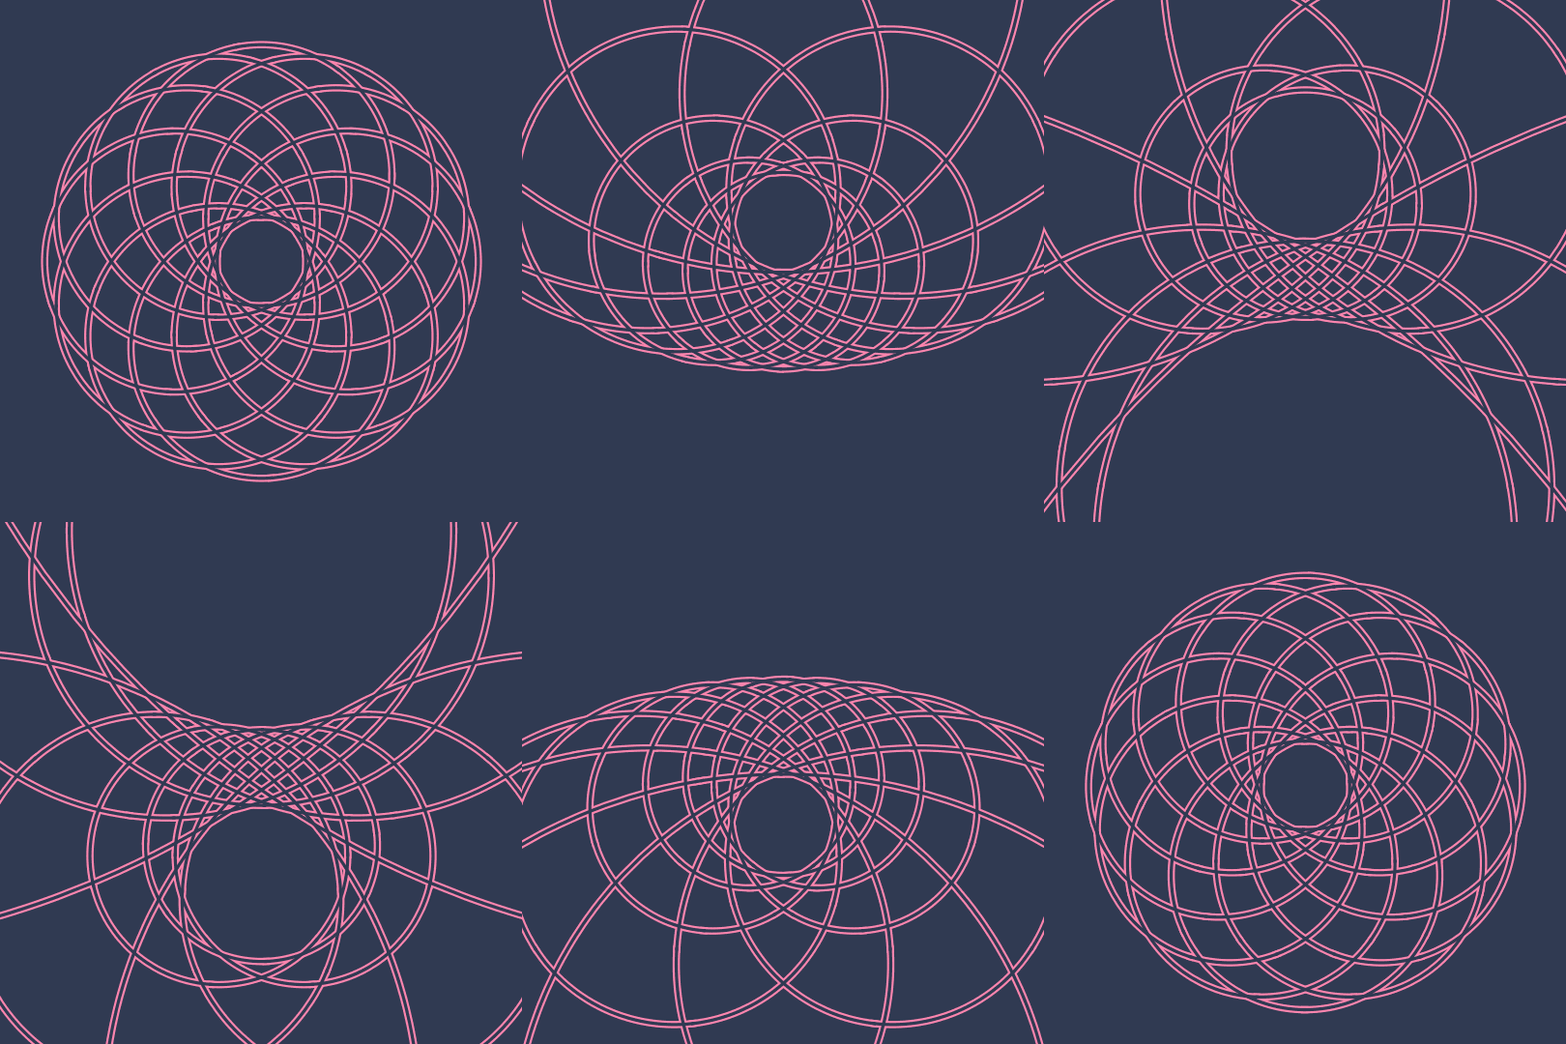
Around and Around
This is the same basic idea as Move Along; quoting from my description there:
Consider a circle of latitude at height $z=-3/4$ on the unit sphere. The orthogonal complements of unit vectors on the circle are planes through the origin in $\mathbb{R}^3$, which we can also interpret as lines in $\mathbb{RP}^2$, the real projective plane.
First of all, the more obvious identification of a point on the sphere with a point in $\mathbb{RP}^2$ is simply that a point on the sphere determines a unique line through the origin. That being said, the point of Move Along was really that we can interpret (most) points on the sphere as lines (not through the origin) in the plane.
Anyway, for this GIF, instead of thinking of the orthogonal complement of the unit vector (or line) as a plane, take the intersection of that plane with the unit sphere, giving a great circle on the sphere (equivalently, take all points on the sphere at a distance of $\pi/2$ from the original point).
Since I'm considering a circle of points on the sphere, this gives a whole circle's worth of great circles on the sphere. In the animation, I stereographically project several of these great circles to the plane while rotating the original circle around the $y$-axis. To be slightly glib, this shows a representative selection from a circle of circles rotating in a circle.
Stereo[{x_, y_, z_}] := {x/(1 + z), y/(1 + z)};

m[t_, ?_, ?_] := RotationMatrix[t, {Cos[?] Sin[?], Sin[?] Sin[?], Cos[?]}];
p[r_, s_, t_, ?_, ?_] := m[t, ?, ?].{Sqrt[1 - r^2] Cos[s], Sqrt[1 - r^2] Sin[s], r};
basis[p_] := Orthogonalize[NullSpace[{p}]];

circle3[p_, ?_] := Cos[?] basis[p][[1]] + Sin[?] basis[p][[2]];
stereocircle3[p_, ?_] := Stereo[circle3[p, ?]];

With[{? = ?/2., t = ?/1., r = -0.75, cols = RGBColor /@ {"#FC85AE", "#303A52"}},
 Manipulate[
  Show[
   Table[
    ParametricPlot[
     Evaluate@Table[stereocircle3[p[r, s, t, ?, ?], ?], {s, 0., 2 ? - 2 ?/12, 2 ?/12}],
     {?, 0, 2 ?},
     PlotStyle -> Directive[Thickness[.01 + .004 i], cols[[i]]], Axes -> False],
    {i, {1, -1}}],
   PlotRange -> 2.4, ImageSize -> 540, Background -> cols[[-1]]],
  {?, 0, ?/2}]
 ]