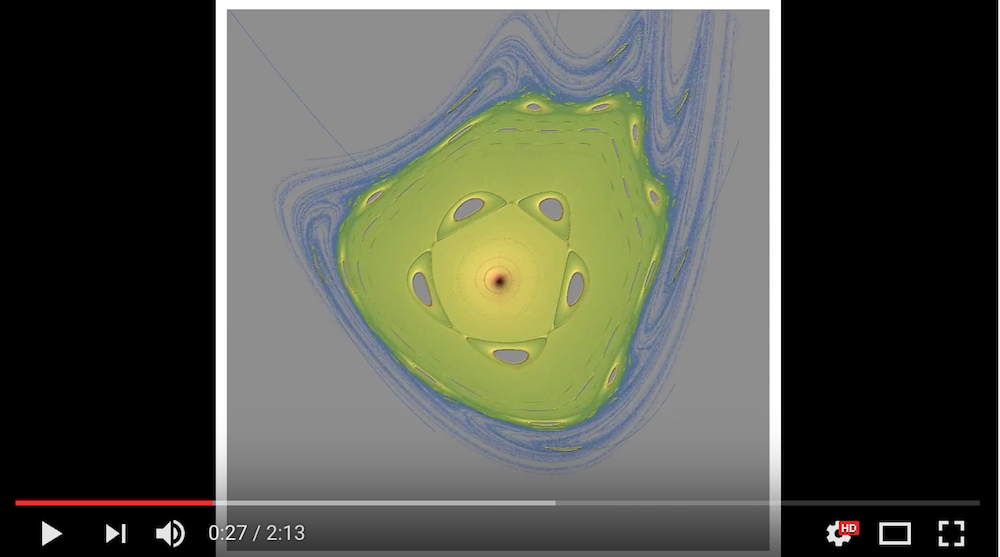
Please see video of chaotic map animation here:

While showing a few thousand points gives one a feeling about a chaotic map
iterations = Compile[{orbit, angle, {n, _Integer}},
  Module[{x, y, l, k, cs = Cos[angle], sn = Sin[angle], \[Sigma]},
   x = orbit;
   y = orbit;
   l = Table[{0., 0.}, {n}];
   k = 0;
   While[k < n && Abs[x] + Abs[y] < 10^3,
               \[Sigma] = x^2 - y;
               {x, y} = {x cs + \[Sigma] sn, x sn - \[Sigma] cs};
                k++; l[[k]] = {x, y}];
   Take[l, k]
   ], CompilationOptions -> {"ExpressionOptimization" -> True}
  ]

Manipulate[
 Graphics[{PointSize[0.002],
   Point[Flatten[
     Table[iterations[x, \[Alpha], Round[10^n]], {x, 0, xm, xm/p}],
     1]]}, PlotRange -> 2],
 {{\[Alpha], 1.3, "angle"}, 0, 2 Pi},
 {{xm, 1.5, "max x"}, 0.1, 3},
 {{p, 50, "steps"}, 2, 100, 1},
 {{n, 2.5, "iterations"}, 1, 4}]
often one needs million points to see many of the details.
So, instead of showing points directly, we accumulate and bin the points using:
toMatrixEntries[l_, dim_] :=
 Module[{L = 1.25}, SparseArray[ Rule @@@ Select[Tally[

      Ceiling[dim Transpose[Transpose[l] + L {1, 1}]/(2 L)]],
                                                                 (1 <=
          Min[#] && Max[#] <= dim) &], {dim, dim}]]


makeReliefPlot[mat_] :=
 With[{logmax = Log@Max[mat]},
  ReliefPlot[mat, PlotRange -> All, Frame -> False,
   ColorFunctionScaling -> False,
   ColorFunction -> (If[# == 0, Gray,
       ColorData["DarkRainbow"][1. Log[#]/logmax]] &),
   ImageSize -> 600]]
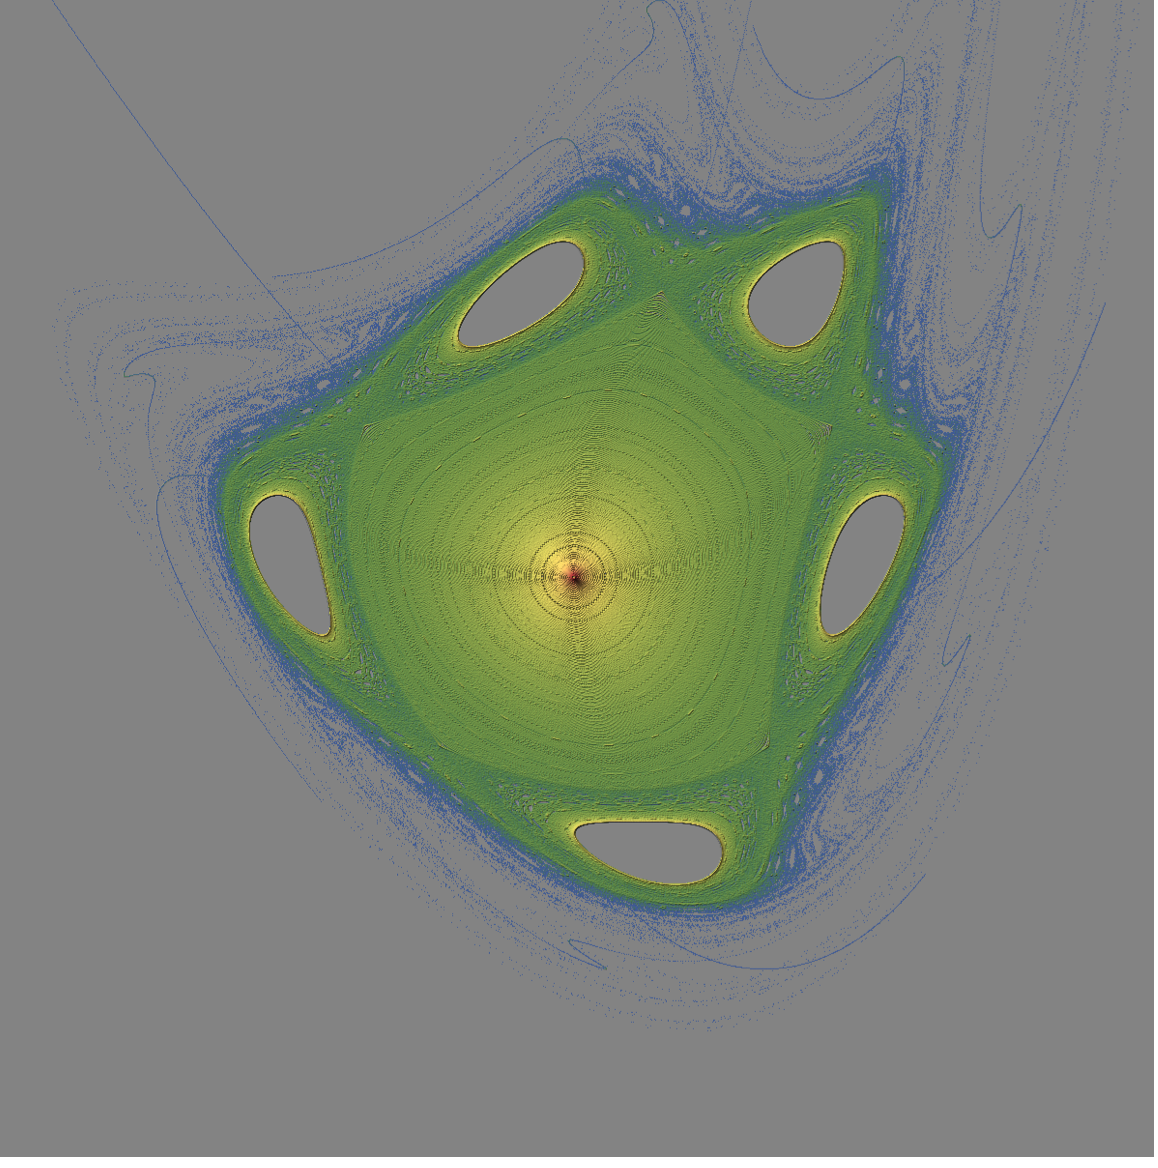
For instance
mat = 0;
Monitor[Do[
   mat = mat + toMatrixEntries[iterations[orbit, 1.34, 10000], 1200],
       {orbit, -1.25, 1.25, 0.001}];,
 Row[{"orbit: ", orbit}]] ;
rp = makeReliefPlot[mat];

makeReliefPlot[mat]

Now doing this for varying angle, we can get the above animation.