Dear friends,
Over the past week, I tried to plot implicit function by Mathematica but failed. I am very disappointed. Hopefully someone help me at this time.
My equation is given by (see below figure):

Where
z0 := 6
d := 12
k := 11800
w0 := 0.025
w[z_] := sqrt[w0^2*(1 + (z/z0)^2)]
deltaphi0[z_] := 0.6/(1 + (z^2/z0^2))
R[z_] := z*(1 + (z0/z)^2)
wm0[z_] := sqrt[w^2/(2*m + 1)]
dm[z_] := (k/2)*((wm0)^2)
g[z_] := 1 + (d/R)
wm[z_] := wm0*sqrt[[g^2 + (d)^2/dm^2]]
Rm[z_] := d*(1 - g/(g^2 + (d/dm)^2))^(-1)
thetam[z_] := ArcTan[d/(dm*g)]
I want to plot a graph to represent the dependence of r (z). I have tried the following code-Mathematica file
[img]/c/portal/getImageAttachment?filename=Trial_code.gif&userId=99427[/img]
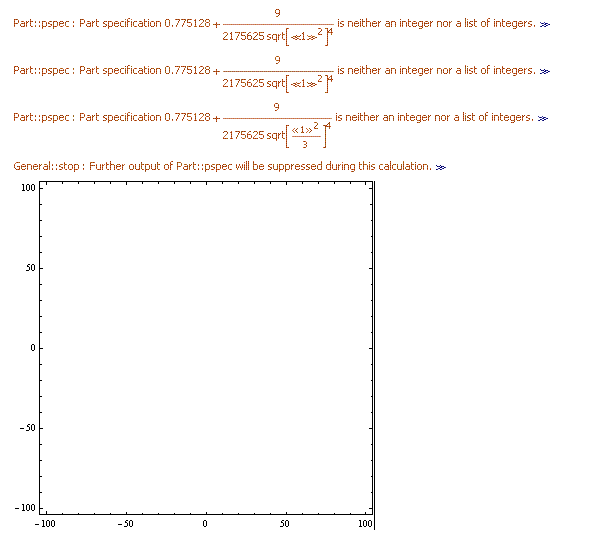
But Mathamatica plots 2 coordinate axes without data (no points).

Please help me!
This is
the mathematica file and
my function.