In the probability speak, the function f is known as a SurvivalFunction. We can define the probability distribution, describing the outage characteristics (either a duration, or an onset, you are not being specific) as
In[80]:= f = (FullSimplify[#1, S > 0] & )[
FunctionExpand[With[{R = 1, n = 3, m = 1, t = 1},
1 - Gamma[m, (m*((2^(2*R) - 1)/S)^(1/n))/t]*(Gamma[m, (m*((2^(2*R) - 1)/S)^(1/n))/t]/Gamma[m]^2)]]]
Out[80]= 1 - E^(-((2*3^(1/3))/S^(1/3)))
In[81]:= odist =
ProbabilityDistribution[{"SF", f}, {S, 0, Infinity}];
We can now sample from this distribution using RandomVariate:
sample = RandomVariate[dist, 10^6];
The distribution has heavy-tail:
In[52]:= Probability[x > 1000, x \[Distributed] sample] // N
Out[52]= 0.24759
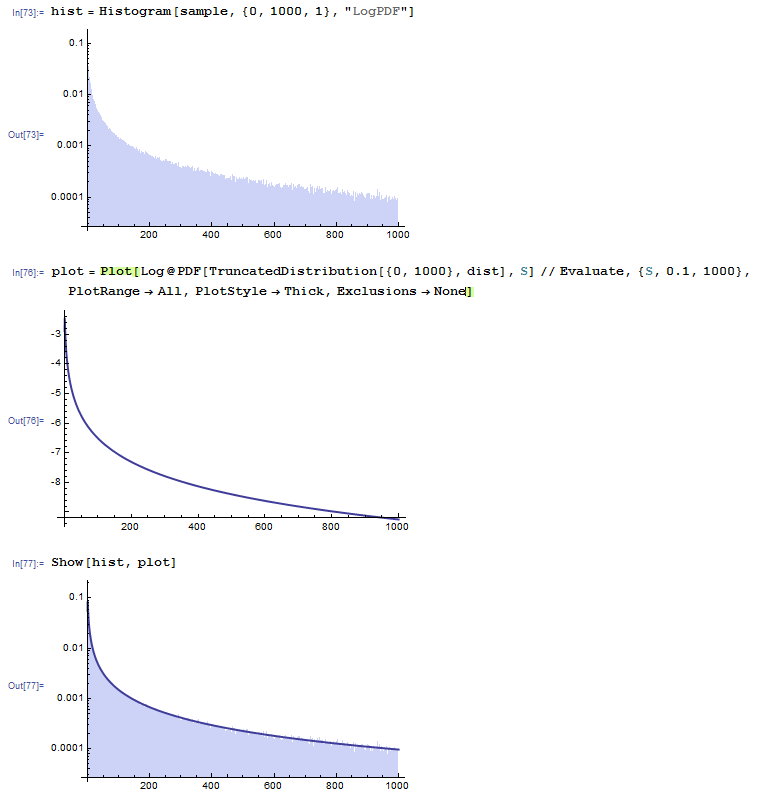
Here we plot a histogram of the data, displaying the logarithm of the probability density function:
hist = Histogram[sample, {0, 1000, 1}, "LogPDF"];
plot = Plot[Log@PDF[TruncatedDistribution[{0, 1000}, dist], S] // Evaluate, {S, 0.1, 1000}, PlotRange -> All, PlotStyle -> Thick, Exclusions -> None];
Show[hist, plot]
Here is a screen-shot:
