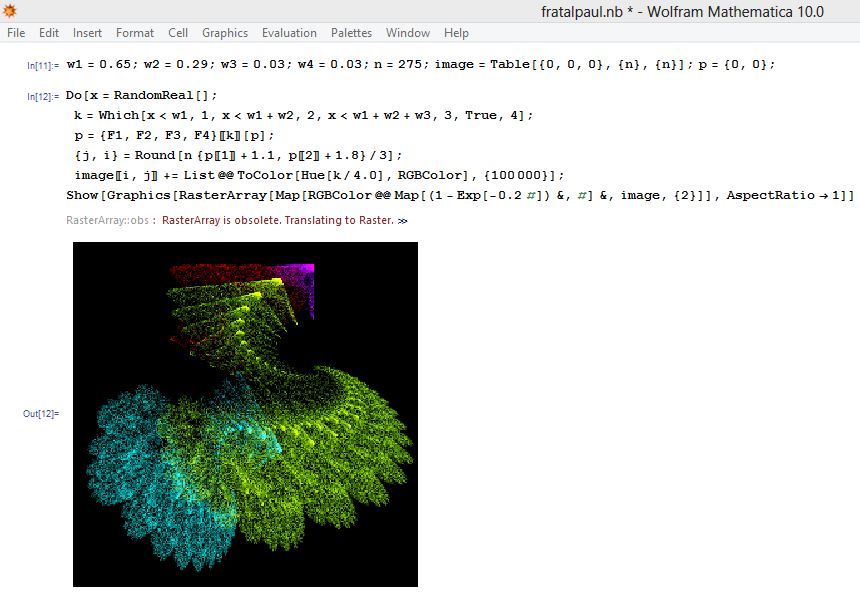
Thank you very much for your great help Sander now if you get the graph that
I thought, I kept browsing Paul's page and I'm interested in the following image,
But now it turns out that you get another error message related to Raster Array, I share the image so you have an idea of what I am talking about, when switching from RasterArray to Raster I get an empty graph again.
To conclude I would like to tell you that Paul used version 4 of
Mathematica that is why it changes the commands considerably. Saludos y
gracias amigo.

V1[{x_, y_}] := {Sin[x], Sin[y]};
F1[p_] := Module[{p2 = {{0.81, -0.33}, {0.08, 0.89}}.p + {0.24, -0.07}}, 0.88p2 + 0.12V1[p2]];
F2[p_] := Module[{p2 = {{0.3, 0.52}, {-0.56, 0.37}}.p + {-0.09, -0.42}}, 0.88p2 + 0.12V1[p2]];
F3[p_] := V1[{{-0.43, 0.38}, {-0.2, -0.44}}.p + {1.74, 1.21}];
F4[p_] := V1[{{-0.49, -0.27}, {0.28, -0.53}}.p + {0.51, 0.62}];
w1 = 0.65; w2 = 0.29; w3 = 0.03; w4 = 0.03;
n = 275; image = Table[{0, 0, 0}, {n}, {n}]; p = {0, 0};
Do[x = Random[]; k = Which[x < w1, 1, x < w1 + w2, 2, x < w1 + w2 + w3, 3, True, 4]; p = {F1, F2, F3, F4}[[k]][p]; {j,i} = Round[n{p[[1]] + 1.1, p[[2]] + 1.8}/3]; image[[i, j]] += List @@ ToColor[Hue[k/4.0], RGBColor], {100000}];
Show[Graphics[RasterArray[Map[RGBColor @@ Map[(1 - Exp[-0.2#]) &, #] &, image, {2}]], AspectRatio -> 1]]