Why does the Plot work but the RevolutionPlot3D fail?
James,
RevolutionPlot3D has the attribute HoldAll, so - just to avoid the error message - the argument needs to be evaluated:
RevolutionPlot3D[Evaluate[z /. OblateSpheroidProfile[r0, r]], {r, 0, r0}]
But I guess the output is not what you are expecting …
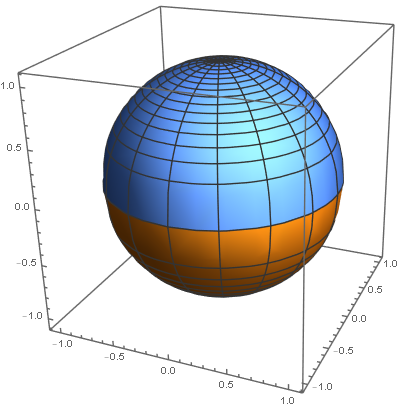
If you would rather like to see a sphere, you need two functions to be “rot-plotted”, e.g. like so:
yFuncts = z /. OblateSpheroidProfile[r0, r];
functs = {r, #} & /@ yFuncts;
RevolutionPlot3D[Evaluate@functs, {r, 0, r0}]

Addendum: We get the same result by putting both of your original functions into a seperate List:
functs1 = List /@ (z /. OblateSpheroidProfile[r0, r]);
RevolutionPlot3D[Evaluate[functs1], {r, 0, r0}, BoxRatios -> {1, 1, 1}]
This is somewhat simpler and more intuitive.
[1]: https://community.wolfram.com//c/portal/getImageAttachment?filename=rotplot.png&userId=32203
Thanks.
But I’m curious as to why RevolutionPlot3D produces an upside down cone rather than the expected surface of rotation of a semicircle/semielipse.
But I’m curious as to why RevolutionPlot3D produces an upside down cone …
This is because yFuncts is interpreted as a single two dimensional function, i.e. when it it plotted as such, it gives a straight line:
yFuncts = z /. OblateSpheroidProfile[r0, r];
ParametricPlot[yFuncts, {r, 0, r0}]
This line is then rotated around the z-axis. Have a look at the examples in the documentation on RevolutionPlot3D.
So I take it that also somehow explains why this produces an inverted cone?
RevolutionPlot3D[Evaluate[z /. OblateSpheroidProfile[r0, r]], {r, 0, r0}]