[?] Understand Violin Plot maximum and minimum values?

Hi,

In the Violin plot, why ‘data’ showes negative values below zero? The maximum of ‘data’ is 11.48, why Violin plot exceeded 12 on the y-axis?

In[10]:= data = {8.58`, 1.85`, 4.95`, 1.36`, 1.58`, 2.06`, 5.46`, 
  11.48`, 8.86`, 9.6`, 2.37`, 5.32`, 5.71`, 5.74`, 5.34`, 5.33`, 
  5.22`, 8.13`, 8.02`, 7.58`, 7.33`, 7.98`, 6.76`, 6.29`, 7.01`, 
  5.78`, 4.12`, 2.44`, 1.97`, 3.06`, 8.46`, 7.25`, 7.38`, 6.72`, 
  7.88`, 6.61`, 2.59`, 6.76`, 6.17`, 1.15`, 5.39`, 4.44`, 6.97`, 
  7.94`, 9.3`, 7.44`}

In[13]:= {Max[data], Min[data]}

Out[13]= {11.48, 1.15}

This is because here a “smoothed out” distribution is shown. If you do not like this, you can change the option ChartElementFunction, e.g.:

DistributionChart[data, ChartElementFunction -> #, 
   GridLines -> {None, Automatic}] & /@ {Automatic, "Quantile", 
  "DensityQuantile", "FadingQuantile", "GlassQuantile", "Density", 
  "HistogramDensity", "LineDensity", "PointDensity"}

Thank you very much Henrik.

So what is the main difference between Violin plot and Density plot.?

DensityPlot is for plotting 2D-densities and does not has per se anything to do with statistics. Maybe this comparison helps:

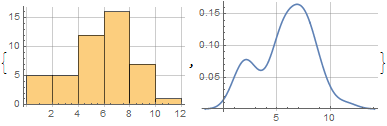
Through[{Histogram, SmoothHistogram}[data, GridLines -> Automatic]]

As you see, the SmoothHistogram exceeds the MinMax values of the data, which is reasonable.
[1]: https://community.wolfram.com//c/portal/getImageAttachment?filename=hists.png&userId=32203

Thank you very much Henrik.