Hi,
I have a question about customising the plot line colours.. for example in the below figure
I would like to use the same colour, but adjust the shade and make a gradient of colour pattern for the plots.. like dark red for the plot D = 2 to a very light red for the plot D = 0.2.. is it possible in Mathematica?
I suggest looking up Hue, Table, and PlotStyle. But his will work with the code as used:
Plot[functions, {x, 0, 1}, PlotStyle -> Reverse[colors]]
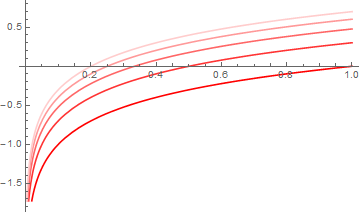
Here is one method:
functions = Table[Log10[a x], {a, 1, 5, 1}];

colors = Table[Hue[1, s], {s, 1, .2, -1/Length[functions]}] // N;

Plot[functions, {x, 0, 1}, PlotStyle -> colors]
Thanks! it helped! I actually did not follow the code well, but it worked on copying and pasting.. How would it be if the colour shading is in the opposite direction?