Message Boards Message Boards

Idea-nets and uniqueness of US inaugural addresses

NOTE: click on images to see high resolution

enter image description here

What is common between a symphony and a novel? They both progress linearly in time. This is why songs match lyrics and music so well. This seems obvious but comprehension of spacial objects is different. You can look at a two-dimensional painting and your sense of art is driven by the simultaneous perception of different spacial regions and their properties: color, contrast, etc. The simultaneous comparison of many different parts is the very mechanism of spacial perception. In contrast an average person cannot read more than one sentence at a time. And listening to the same parts of melody simultaneously can create cacophony or at least shift from the intended by creator sound. Because our consciousness is forced to constantly move though time and not space, we perceive spacial and temporal structures differently.

We use memory to improve comprehension of temporal phenomena. But it is till quite hard to remember and compare many different moments simultaneously. Remembering the secondary sense of "relations" or "correlations" between different moments is even harder. What if we could extract important information from a temporal structure and reflect it via a spacial visual representation?

As an example let's take US presidents inaugural addresses. They are short pieces of text that at times may seem very similar to each other. So there there are 2 levels of comparison:

  1. What are ideas and relations between them in a single speech?

  2. What is common and different between different speeches?

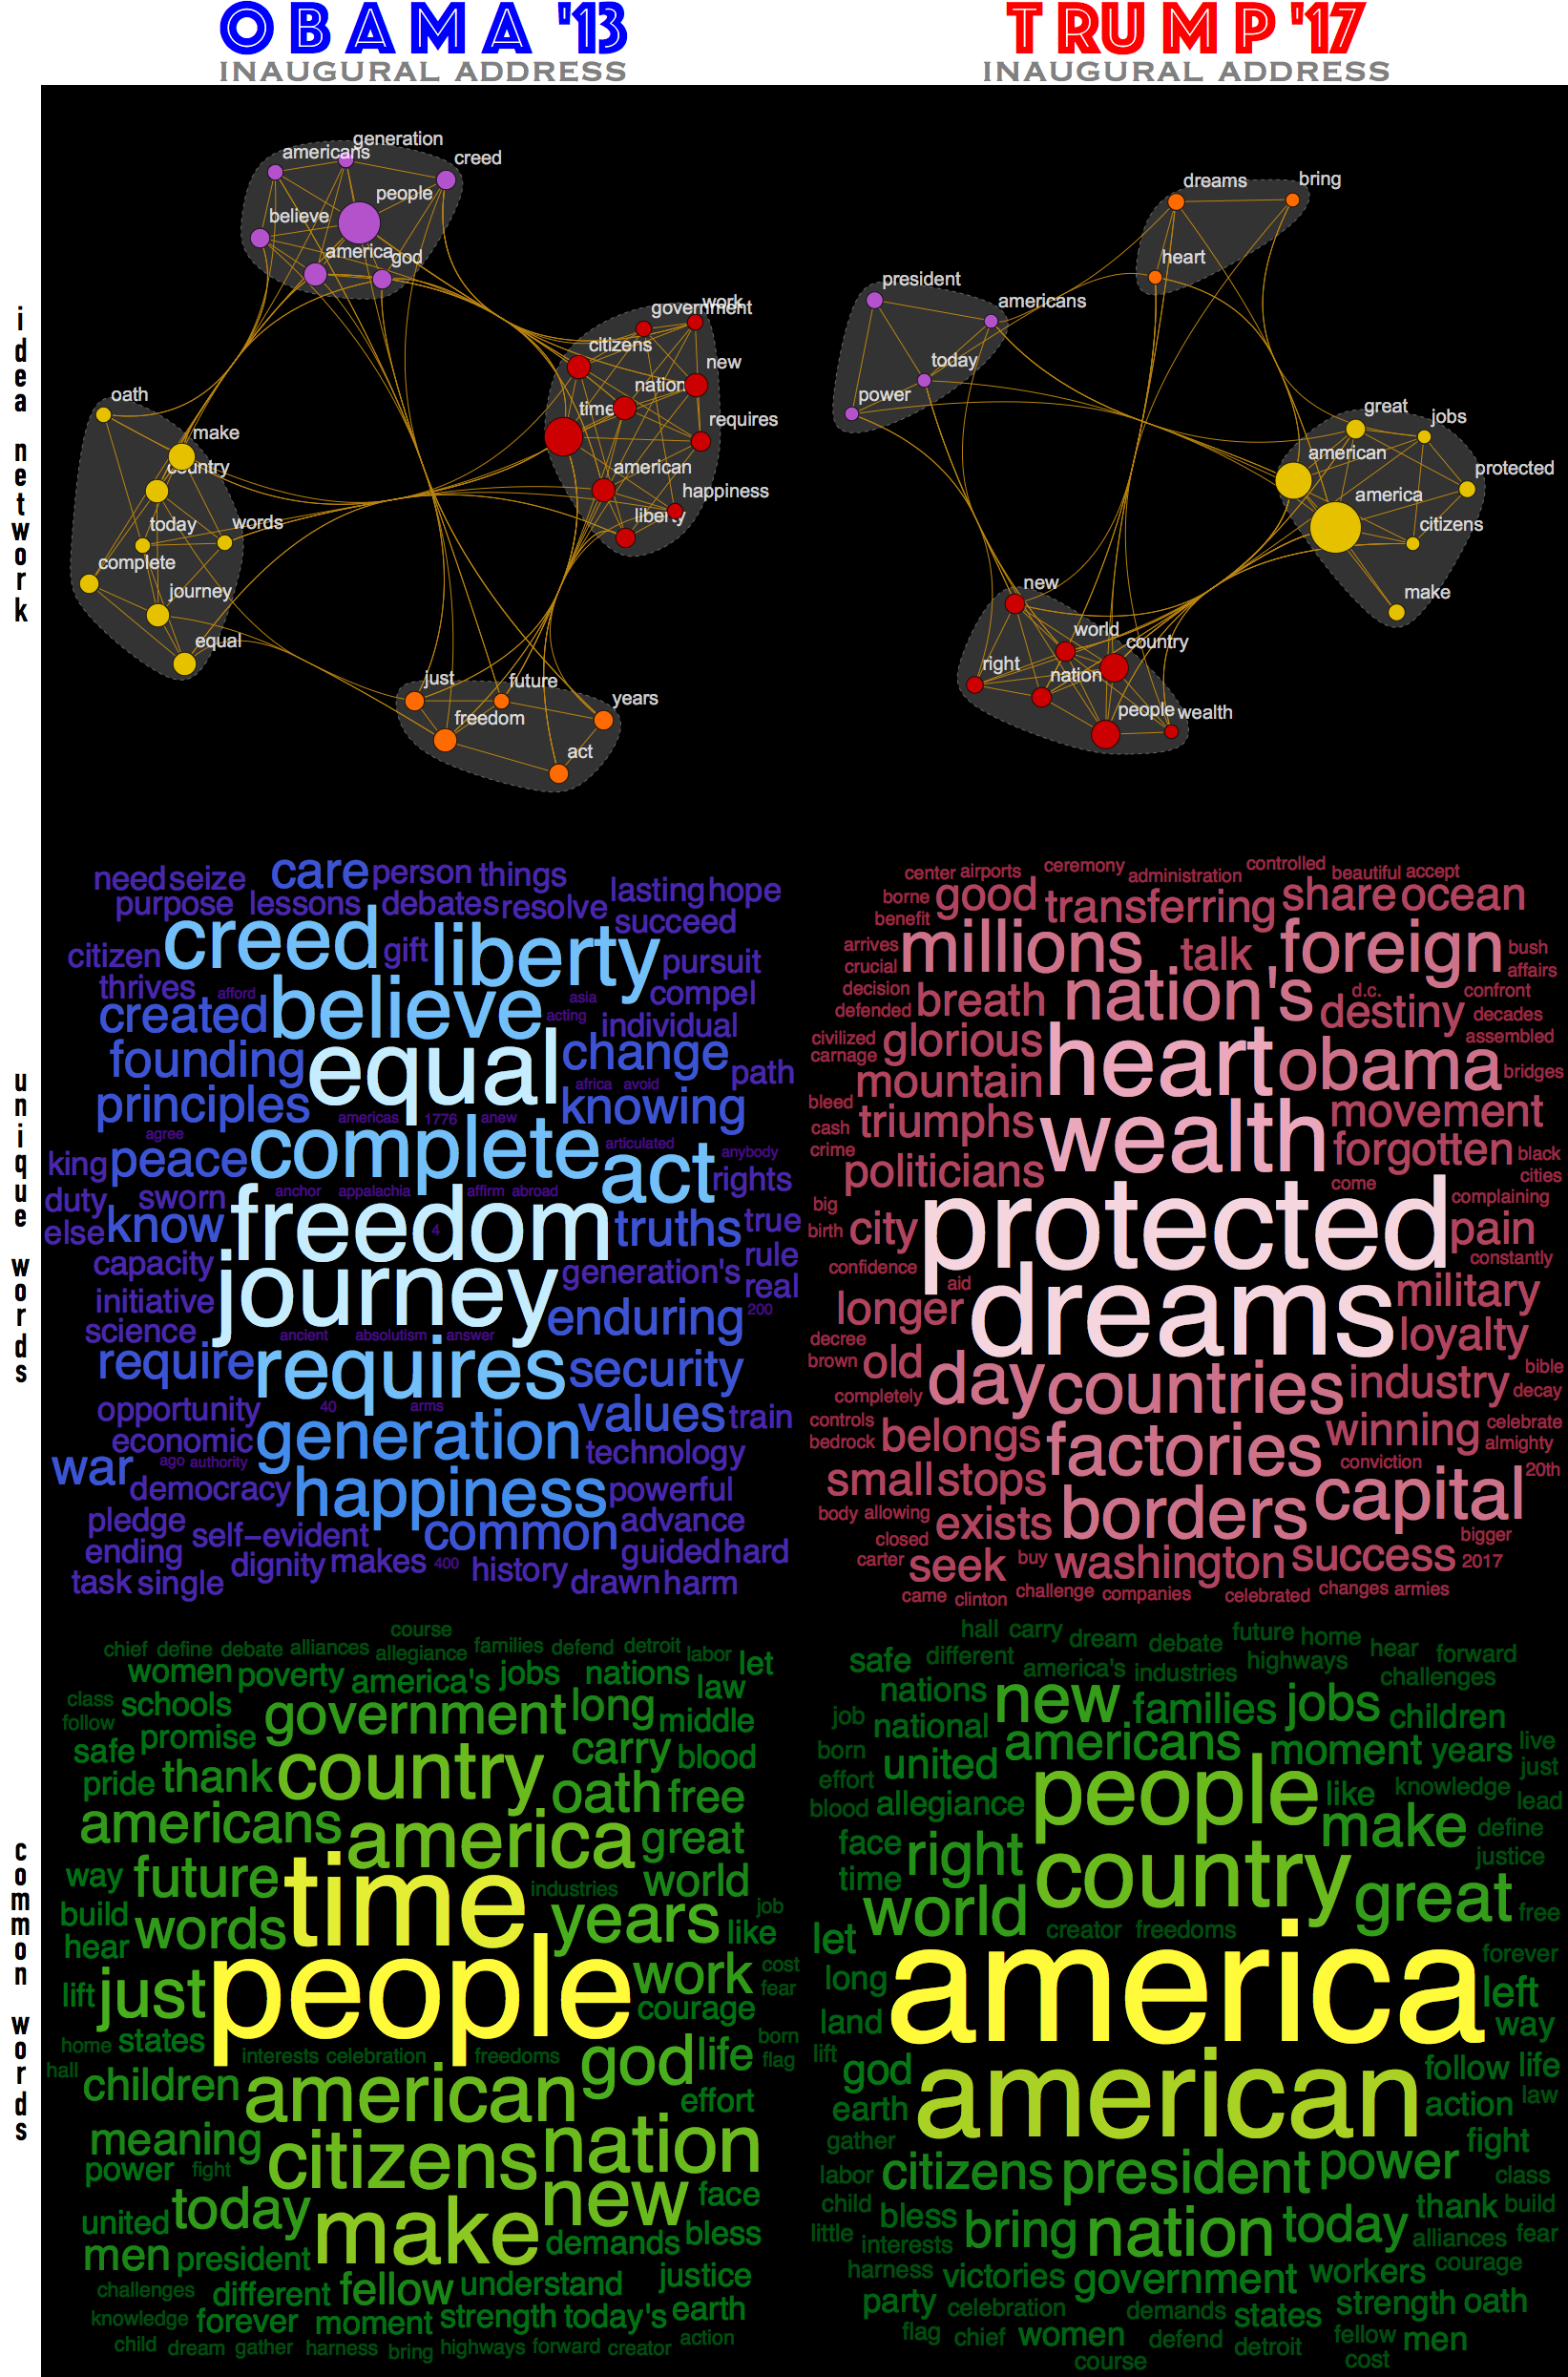
It is possible to create some very simple tools of text processing that give some immediate insight. In the image above you see a take on Obama 2013 and Trump 2017 inauguration speeches. Top idea-networks reflect the top ideas and relationships between them inside a speech. The top-terms are also clustered to indicate which ideas are in the tighter relationships. And word clouds show common and unique top words for each presidential address. Also notice, that while the common words are "common" they have different weights for each address, which redistributes the meaningful stress between common ideas.

The Wolfram Language code for building these objects is below. It works in a very simple way. For word clouds you find unique and common words and then find their statistical weights. For the idea networks it is just a little bit more subtle. First you find "top terms" by deleting stop words and tallying the rest. Than you say that only tally weighting greater than a specific threshold counts as a "main idea" on which you build your network. The edges are drown between top-terms that are direct neighbors in the text. Thresholding of tally could be a bit misleading as selection of this cutoff is subjective and per-candidate specific. This means that a threshold chosen for one candidate may not work as well for the other because they may generate different statistical distribution of top-terms in the speeches. For Obama and Trump in the image above I used slightly different thresholds to get nicer visualizations. As a counterexample, below are net-ideas of inaugural addresses for the rest of 56 US presidents thresholded at the same "Obama-level". As you can see sometimes the nets are overloaded and sometimes they are too simple. Which in itself tells something about different structures of texts and prompt us for careful treatment of the threshold.

The final code and more details are given below.

enter image description here

A unique feature of Wolfram Language a multitudes of built-in curated data. We can access all inauguration speeches as

allOBJ = SortBy[ResourceData["Presidential Inaugural Addresses"], "Date"];

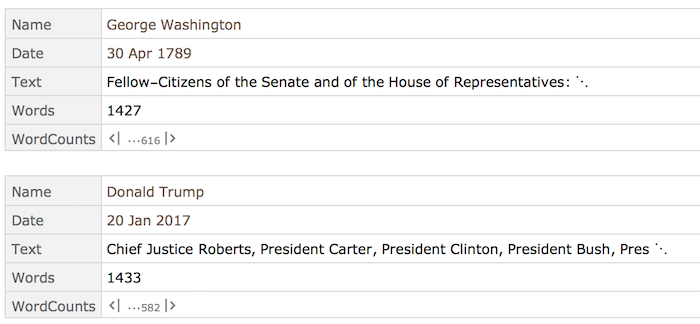
This is a sample of the dataset:

Column[allOBJ /@ {1, -1}]
enter image description here

Extract all texts and names and dates:

allTEXT = Normal[allOBJ[All, "Text"]];
allNAME = Normal[allOBJ[All, DateString[#Date, "Year"] <> " " <> CommonName[#Name] &]];

Idea-network

Idea-nets are built

ideaNET[text_String,order_]:=
Module[
    {wordsTOP, edges,resctal, words=TextWords[DeleteStopwords[ToLowerCase[text]]]},
    resctal=Transpose[MapAt[N[Rescale[#]]&,Transpose[Tally[words]],2]];
    wordsTOP=Select[resctal,Last[#]>=order &];
    edges=UndirectedEdge@@@DeleteDuplicates[Sort/@DeleteCases[
         Partition[Cases[words,Alternatives@@wordsTOP[[All,1]]],2,1],{x_String,x_String}]];
    CommunityGraphPlot[
       Graph[edges,
         VertexSize->Thread[wordsTOP[[All,1]]->.1+.9wordsTOP[[All,2]]],
         VertexLabels->Automatic,VertexLabelStyle->Directive[20,White,Opacity[.8]],
         GraphStyle->"Prototype",Background->Black],
    CommunityBoundaryStyle->Directive[GrayLevel[.4],Dashed],
    CommunityRegionStyle->GrayLevel[.2],
    ImageSize->800{1,1},
    PlotRangePadding->{{.1,.3},{0.1,0.1}}]
]

Example: JFK inaugural address:

ideaNET[allTEXT[[-15]], .17]

enter image description here

Unique and common top-terms

The code that makes very top graphics is:

plusCLOUD[allTEXT[[-2]], allTEXT[[-1]], "o b a m a  '13", "t ru m p '17"]

With idea-nets defined as above and plusCLOUD as below:

plusCLOUD[text1_String,text2_String,label1_String,label2_String]:=
Module[
    {same,
    words1=TextWords[DeleteStopwords[ToLowerCase[text1]]],
    words2=TextWords[DeleteStopwords[ToLowerCase[text2]]]},
    same=Intersection[words1,words2];
    Grid[
       {{"",Column[{
          Style[label1,80,Blue,FontFamily->"Phosphate"],
          Style["inaugural address",45,Gray,FontFamily->"Copperplate"]
         },Alignment->Center],
         Column[{
          Style[label2,80,Red,FontFamily->"Phosphate"],
          Style["inaugural address",45,Gray,FontFamily->"Copperplate"]
         },Alignment->Center]},
       {Framed[Column[Style[#,35,FontFamily->"DIN Condensed"]&/@Characters["idea network"],
         Alignment->Center],FrameStyle->White,FrameMargins->10],
       ideaNET[text1,.21],ideaNET[text2,.18]},
       {Framed[Column[Style[#,35,FontFamily->"DIN Condensed"]&/@Characters["unique words"],
         Alignment->Center],FrameStyle->White,FrameMargins->10],
       WordCloud[DeleteCases[words1,Alternatives@@same],ImageSize->800{1,1},
         ColorFunction->(ColorData["DeepSeaColors"][(.2+#)/1.2]&),Background->Black],
       WordCloud[DeleteCases[words2,Alternatives@@same],ImageSize->800{1,1},
         ColorFunction->(ColorData["ValentineTones"][(.2+#)/1.2]&),Background->Black]},
       {Framed[Column[Style[#,35,FontFamily->"DIN Condensed"]&/@Characters["common words"],Alignment->Center],FrameStyle->White,FrameMargins->10],
       WordCloud[Cases[words1,Alternatives@@same],ImageSize->800{1,1},
         ColorFunction->(ColorData["AvocadoColors"][(.2+#)/1.2]&),Background->Black],
       WordCloud[Cases[words2,Alternatives@@same],ImageSize->800{1,1},
         ColorFunction->(ColorData["AvocadoColors"][(.2+#)/1.2]&),Background->Black]
       }},
    Spacings->{0, 0}]
]
POSTED BY: Vitaliy Kaurov
10 Replies

This is a cool post Vitaliy! Have you tried the same analysis on President Biden's address (which has recently been added to the Presidential Inaugural Addresses resource)?

I used the same data in an example for my ReadabilityScore resource function (under Neat Examples): https://resources.wolframcloud.com/FunctionRepository/resources/ReadabilityScore/

I'll have to update the plot with Biden when I next submit an update to the function.

POSTED BY: Jesse Friedman

Thank you @Jesse ! Yes, I'd like to do that soon. I am considering first giving an upgrade to the function KeywordsGraph that would give am option of counting different grammatical forms as one keyword (such as, for instance, "cat" and "cats"). BTW, great example with ReadabilityScore and American presidents’ inaugural addresses!

POSTED BY: Vitaliy Kaurov

I have published a relevant function KeywordsGraph:

https://resources.wolframcloud.com/FunctionRepository/resources/KeywordsGraph

enter image description here

POSTED BY: Vitaliy Kaurov
Posted 8 years ago

I am extremely new to all and anything Wolfram. And perhaps I just in a "mood" (apologies), but, ehh...

Could this be useful as a "BS" detector? Maybe even provide an actual computable definition of "BS"???

POSTED BY: Victor Lewis
Posted 8 years ago

Hi Vitaliy,

This is a great idea with many possible extensions. This code could have interesting applications in literature. My incompetence with the Cyrillic alphabet and Slavic language leads me to an idea where many people may be interested in the results.

These are difficult times throughout the world, when we are all hoping for the best possible leadership. It could be a mistake to think that the best voices will be from those who win the contest for public or private office. Maybe you have already guessed what I'm hinting at: yes, Bulgakov, the samizdat hero, from Kiev, Ukraine.

Quickly searching google I find many translations of (in English) "Heart of a Dog", even a few PDF files that could be mined for plaintext. Side by side comparisons of the translations would give us a quantitative idea about the fluctuations between texts. Do you think this is possible using your code? Can your code operate on Cyrillic texts?

"Heart of a Dog" is a masterpiece of science fiction. I'm sure it's a risk to say out loud, but I think more people in the English speaking world should read Bulgakov. That being said, science fiction can sometimes have a gender biased audience. In particular I think the details of this story might be too grotesque and masculine for some women. But I have recently heard that the woman poet Anna Akhmatova is also a worthwhile Ukrainian-born samizdat hero, also active "during the terrible years of the Yezhovshchina". Again many translations exist, so another question: could your method be adapted to compare translations of short form writing such as a poem?

Thanks, Brad.

POSTED BY: Brad Klee
Posted 8 years ago

Hi Vitaliy,

I write a simple n-gram WordCloud function below. The code quality can still improve, but it works with n-gram idea. Do you have any suggestion to improve the code quality or effiency?

Attached the notebook format for better understand.

nGramWords[text_String, n_Integer: 4, filterLevel_Integer: 2] := 
  Module[{
    words = DeleteStopwords[TextWords[ToLowerCase[text]]], 
    nGramInitial, nGramTable, removeValue, newLine},
   seperate[list_] := 
    With[{l = Length@list}, {Take[list, l - 1], Take[list, -(l - 1)]}];
   nGramInitial = 
    Normal@Table[
      Select[WordCounts[StringRiffle[words], 
        i], # >= filterLevel &], {i, n, 1, -1}];
   nGramInitial = 
    Join[Drop[
      nGramInitial, -1], {({#[[1]]} -> #[[2]]) & /@ 
       Last@nGramInitial}];
   nGramTable = {};
   nGramTable = Append[nGramTable, First@nGramInitial];
   Do[
    removeValue = 
     Flatten@Table[
       Thread[Rule[seperate[First@Last[nGramTable][[i]]], 
         Table[-Last@Last[nGramTable][[i]], {2}]]], {i, 1, 
        Length@Last[nGramTable]}];
    newLine = 
     Sort[Select[
       Flatten@If[
           Length[#] > 
            1, #[[1]][[1]] -> (#[[1]][[2]] + #[[2]][[2]]) , #[[
            1]]] & /@ 
        GatherBy[Join[removeValue, nGramInitial[[j]]], 
         First], #[[2]] >= 1 &], #1[[2]] > #2[[2]] &];
    nGramTable = Append[nGramTable, newLine], {j, 2, n}];
   Sort[{StringRiffle[#[[1]]], #[[2]]} & /@ 
     Select[Flatten[nGramTable], #[[2]] >= filterLevel &], #1[[
       2]] > #2[[2]] &]
   ];

Compare 1-gram with n-gram WordCloud compare common words and unique words

Attachments:
POSTED BY: Frederick Wu

Thanks for posting, @Frederick Wu, I will have to find some time to dig through this. I think if you could add some explanations how your code for n-gram WordCloud works, this actually could make a separate nice post! Especially if the obvious difference between regular WordCloud would be demonstrated in some cases. Please consider this ;-)

POSTED BY: Vitaliy Kaurov
Posted 8 years ago

Hi Vitaliy,

I find "Idea-network" is very hard to understand, maybe it can evaluate the complex of text, but it seems not much useful.

However, the common and unique word cloud is inspired me a lot. Maybe an intersection of all texts or a lots texts would get a fairly acceptable common words (with certain frequency level).

Another suggestion, n-gram wordcloud will contain more useful and readable information instead of one-gram. http://hack-r.com/n-gram-wordclouds-in-r/

I saw, Eric written on Wolfram blog, one image of wordcloud contain mutilple math words, it should be n-gram wordcloud? http://blog.wolfram.com/2016/12/22/the-semantic-representation-of-pure-mathematics/

POSTED BY: Updating Name

Dear Vitaliy,

that is indeed very beautiful and impressive. It is quite amazing how much information is distilled into these images.

Thanks for sharing, Marco

POSTED BY: Marco Thiel

Impressive compactness!

POSTED BY: Sander Huisman
Reply to this discussion
Community posts can be styled and formatted using the Markdown syntax.
Reply Preview
Attachments
Remove
or Discard

Group Abstract Group Abstract