Hi Amin,
I don't think that that is a bug. FindDistribution involves a stochastic process. If you fix the random seed the results will be exactly identical.
FindDistribution[cana, 5, All, TargetFunctions -> "Continuous", "RandomSeed" -> 23544325]
In other words,
FindDistribution[cana, 5, All, TargetFunctions -> "Continuous"]
changes every time you execute it, whereas
FindDistribution[cana, 5, All, TargetFunctions -> "Continuous", "RandomSeed" -> 23544325]
Does not.
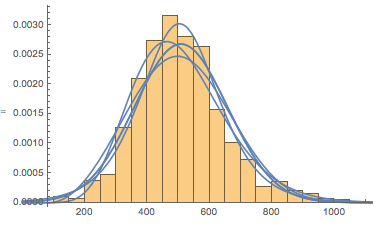
BTW, you can also look at the difference of the estimated distributions without fixing the random seed. Here are all 5 estimates:
Show[Histogram[cana, Automatic, "PDF"],
Plot[PDF[#, x], {x, 0, 1200}] & /@ Evaluate[Normal[(Normal@FindDistribution[cana, 5, All, TargetFunctions -> "Continuous"])][[All, 1]]]]
If you look for the different estimates of, say, the GammaDistribution if you run the thing several times it looks like this:
Show[Histogram[cana, Automatic, "PDF"],
Plot[PDF[#, x], {x, 0, 1200}] & /@
Flatten[Table[Select[Normal[Normal[FindDistribution[cana, 5, All,
TargetFunctions -> "Continuous"][[All, 1]]]][[All, 1]], Head[#] == GammaDistribution &], {5}]]]
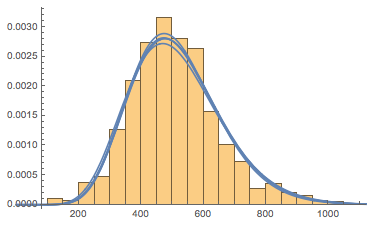
I would assume that the variation between the estimates becomes smaller if you have more points in your dataset.
Cheers,
Marco
PS: I think one should only use the word "bug" in the title if it is confirmed.


