Message Boards Message Boards

0
|
3521 Views
|
2 Replies
|
2 Total Likes
View groups...
Share
Share this post:

2D plot with 3rd dimension color coded

Posted 11 years ago
Good afternoon, 

I have an array of data (dimensions 7489 x 3) in the form {{x1,y1,z1}, {x2,y2,z2}.......{x7489, y7489, z7489}}. I would like to do a 2D plot of this using the first two elements {xi,yi} and then uze the third element zi to color code the plot. I have tried different things, none of which seem to work. Listplot does not work with Nx3 arrays, and ListDensityPlot does not seem to work either. 

Any help would be appreciated. 
Thank you!
POSTED BY: F A
2 Replies
Just make sure that all of these are true:
MatrixQ[data]
And@@Flatten[Map[NumericQ,data,{2}]]
And@@(Length[#]==3&/@data)
The first tests if your data is a matrixq, not a higher or lower dimensional array.
The second one will test if all of these are numbers.
The third will make sure all the sublists are length 3. (you could also do this using Dimensions and MatchQ)
POSTED BY: Sander Huisman
ListDensityPlot should work in your case as shown in this documentation example. Just reproducing it here. Get data to show a map of Illinois according to the elevation of its cities:
cities = Cases[CityData[All], {_, "Illinois", "UnitedStates"}];
data = Table[{CityData[c, "Longitude"], CityData[c, "Latitude"], CityData[c, "Elevation"]}, {c, cities}];
Note the data have in principle similar to your case dimensions:
data // Dimensions
(* ========= out =========
{1313, 3}
========= out ========= *)
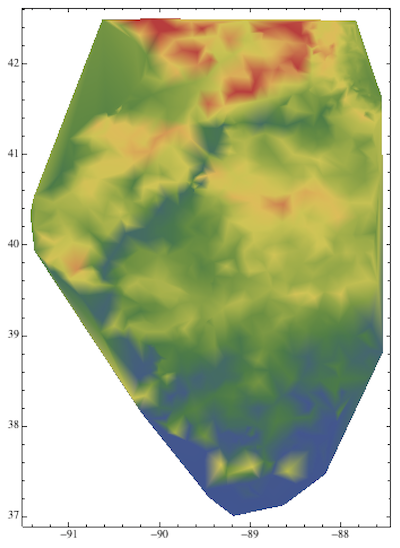
Now plot:
ListDensityPlot[data, AspectRatio -> Automatic, ColorFunction -> "DarkRainbow"]

POSTED BY: Vitaliy Kaurov
Reply to this discussion
Community posts can be styled and formatted using the Markdown syntax.
Reply Preview
Attachments
Remove
or Discard

Group Abstract Group Abstract