Take the following:
ParametricPlot3D[{Sin[t], Cos[t], t}, {t, -Pi, Pi},
 AxesLabel -> {x, y, z}, PlotRange -> All,
 PlotStyle -> Directive[RGBColor[0, 0, 0], Thickness[.01]],
 PlotPoints -> 9000, MaxRecursion -> 15, ViewPoint -> Top]
Notice how I obtain the following when it's plotted:
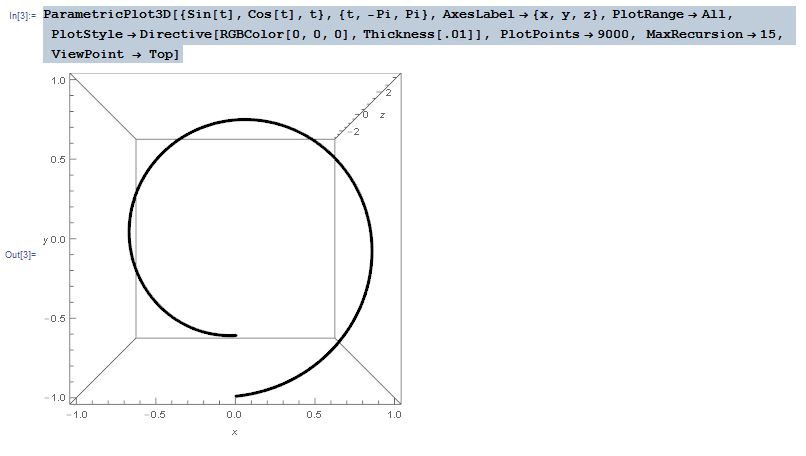
Notice how, even though this is the top view, I'm not exactly seeing a direct projection of the vector-valued function onto the xy plane. If I was seeing a complete projection onto the xy plane, one end of the helix would appear meet up with the other end. There seems to be some factor of depth that's affecting the way the graphics are rendered that prevents me from seeing what I expect to see.
My question is this: is there any way to force these 3D graphics to render so that, whenever viewing any particular side of the bounding box, this "depth factor," or viewing angle, or field of view, or whatever it's called doesn't produce the above results? I would like to see a complete projection whenever I rotate the graph in 3D space and view it on any individual plane.


