Hi Jesus,
Your picture is an isometric line drawing. All such images are easy to draw by constructing the three dimensional curves, choosing the view vectors, and projecting into the plane. If you get more detailed, the main difficulty becomes the ordering and stacking along the axis of projection. I think it's advantageous to use Graphics as opposed to Graphics3D because the output of Graphics is a scalable vector, seems to be more reliable for including in papers. I've already given a few examples in a recent topic:
Plotting the Contours of Deformed Hyperspheres
Here's another example more along the lines of what you are looking for:
Function Definitions
Amp = Normalize[(-1)^# Exp[-#] & /@ Range[4]];
fs = Times[Cos[k x] /. k -> (# 2 Pi) & /@ Range[4], Amp];
F = Total[fs];
f0 = -(F /. x -> 0);
F2 = f0 + F;
View Settings
ViewV = Normalize@ {1, -1, 1};
xOrtho = Normalize@{1, 1, 0};
yOrtho = Normalize@Cross[ViewV, xOrtho];
Projector = {xOrtho, yOrtho};
colors = Partition[{Red, Orange, Yellow, Green, Blue}, 2, 1];
intRatio = {25, 9, 3, 2};
Curve to Points
GetLine[fx_, xm_, xp_] :=  Cases[Plot[fx, {x, xm, xp}, PlotRange -> All], Line[_], Infinity]
GetLine[fx_, xm_, xp_, n_, m_] :=  Join[#, {{#[[-1, 1]], 0}, {#[[1, 1]], 0}} ] & /@ Partition[
With[{nMax = Max[Flatten[Partition[Range[0, n], m, m - 1]]]},
N[Map[{(xm + # (xp - xm)), fx /. x -> (xm + # (xp - xm))} &,
Range[0, nMax - 1]/(nMax - 1)]]  ], m - 1, m]
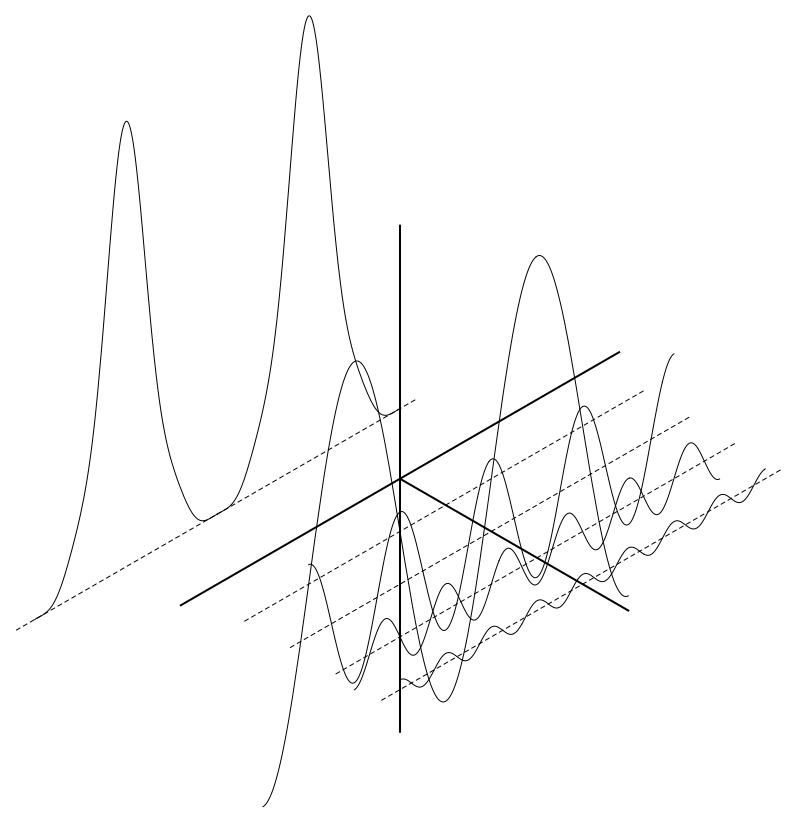
Simple Output
Graphics[Join[
MapThread[{{Dashed,
Line[Projector.# & /@ {{#2/4, -1.1, 0}, {#2/4, 1.1, 0}}]},
GetLine[#1, -1, 1] /. {y_, z_} :> Projector.{#2/4, y, z}} &,
{fs, Range[4]}],
{{Thick, Line[Projector.# & /@ {{0, 0, 0}, {5/4, 0, 0}}],
Line[Projector.# & /@ {{0, 0, -1.2}, {0, 0, 1.2}}],
Line[Projector.# & /@ {{0, -1.2, 0}, {0, 1.2, 0}}]}, {
{Dashed, Line[Projector.# & /@ {{-1, -1.1, -f0}, {-1, 1.1, -f0}}]},
GetLine[F, -1, 1] /. {y_, z_} :> Projector.{-1, y, z}
}}], ImageSize -> 800]
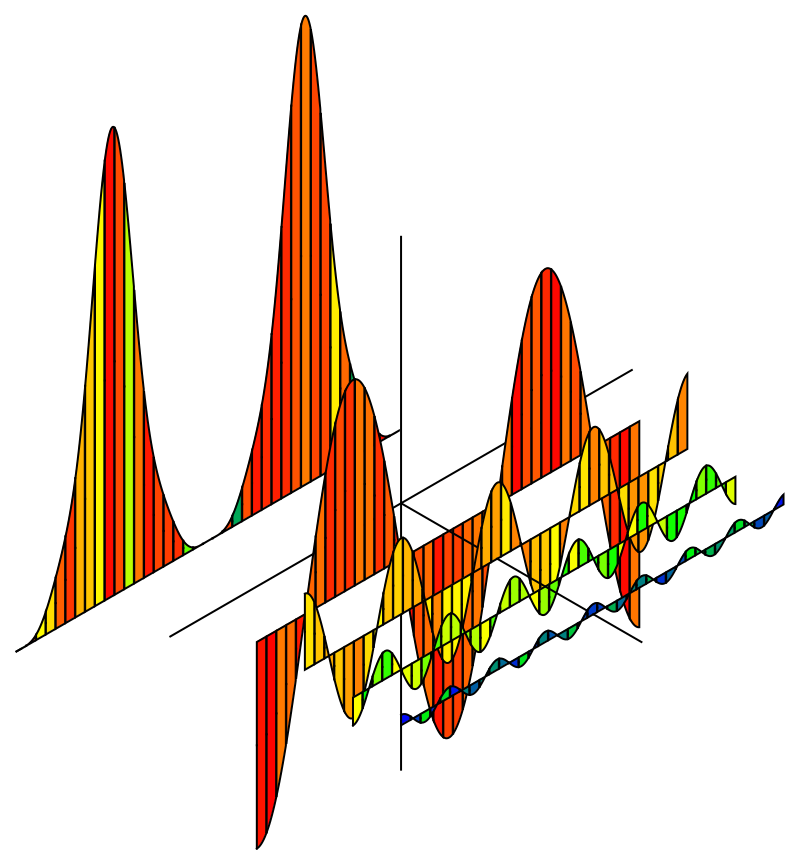
Color Line Drawing
g1 = Graphics[{EdgeForm[Thick], MapThread[{#1, #2} &,
{RandomSample[
Flatten[MapThread[
Table[Blend[#1, RandomReal[{0, 1}]], {#2}] &, {colors,
intRatio}]]],
Polygon[# /. {y_, z_} :> Projector.{-1, y, z - f0}] & /@
GetLine[F2, -1, 1, 2000, 50]}]}];

Show[ g1, Graphics[{Thick,
Line[Projector.# & /@ {{0, 0, 0}, {1/4, 0, 0}}],
Line[Projector.# & /@ {{0, -1.2, 0}, {0, 1.2, 0}}],
Line[Projector.# & /@ {{0, 0, -1.2}, {0, 0, 1.2}}]}],
MapThread[DrawPart, {fs, Range[4]/4, Table[1/4, {4}], colors}],
ImageSize -> 800]