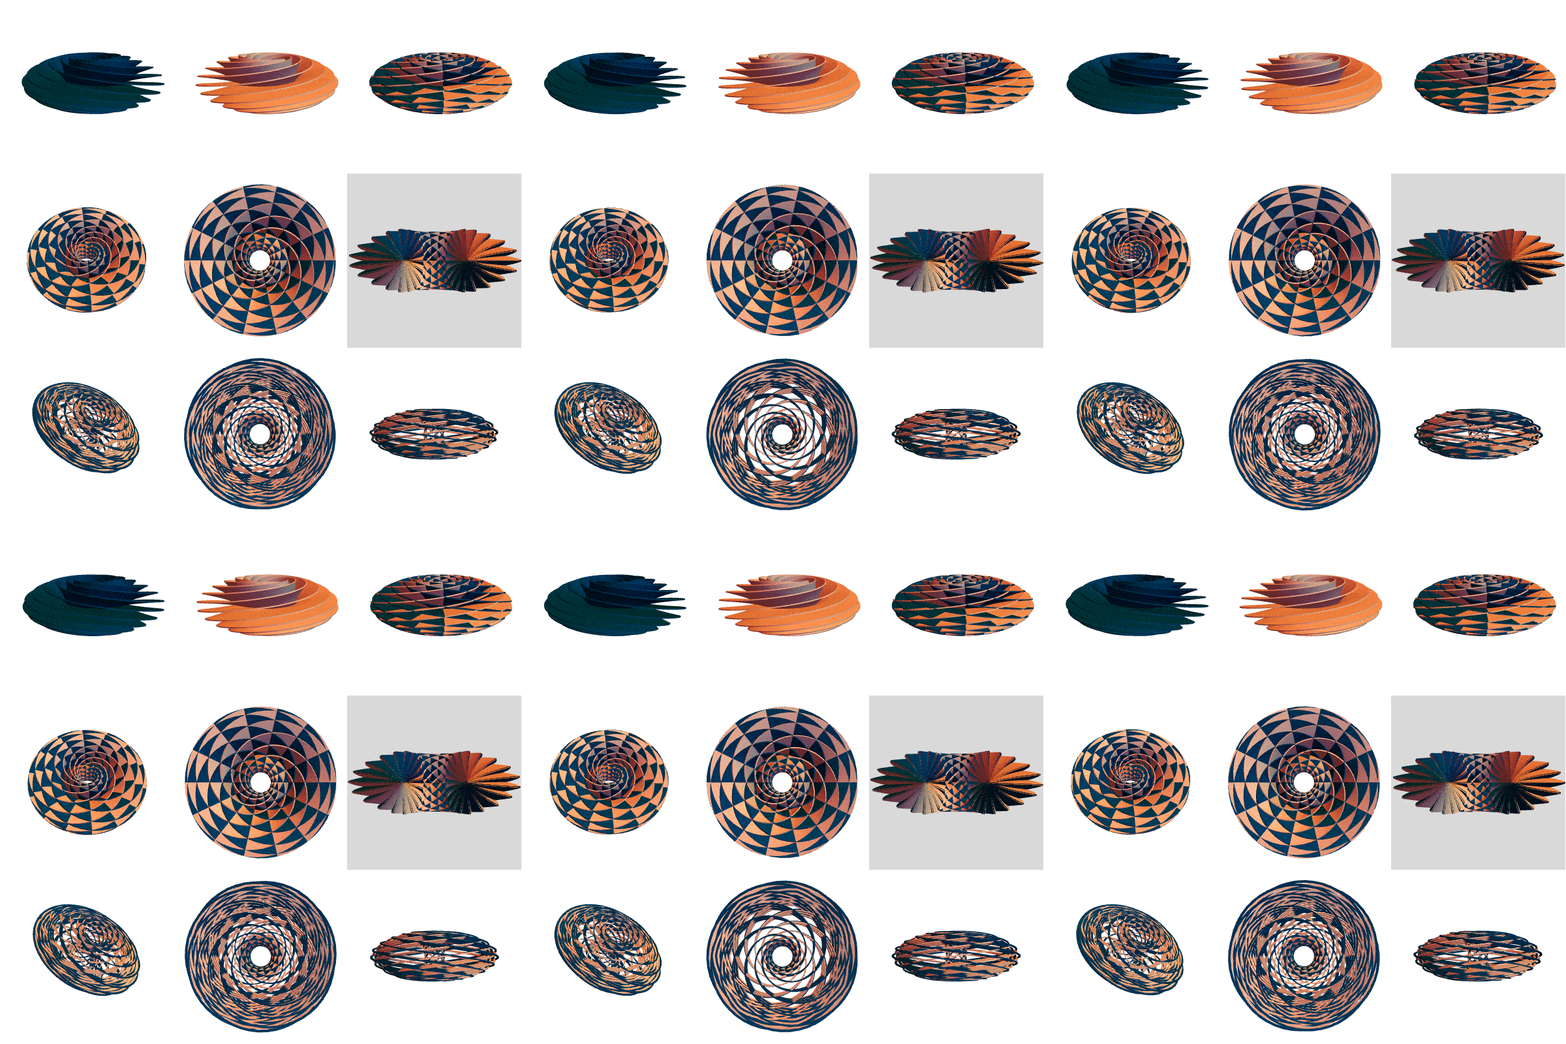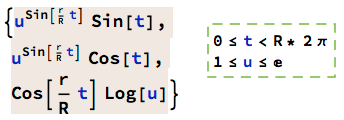
Here we see some alternate views and versions of the shape governed by: 
One is rotating one way, and the same shape of opposite chirality is rotating the other way. I've chosen R/r =E (approximately) because it results in a 90degree overcrossing at the center, which I think looks cool and seems like a natural choice.
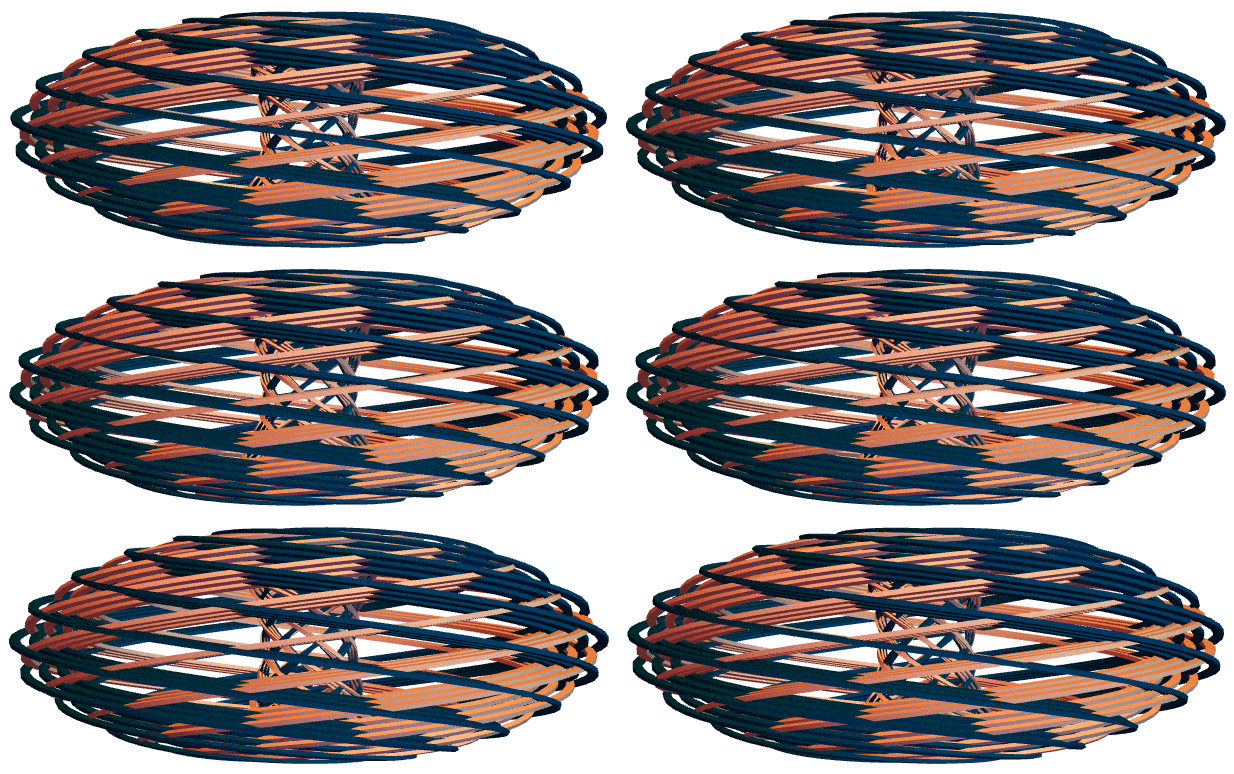
Here is a closer look at the last image:

r = 7.;
R = 19.;
plaht1[d_, rotation_] := ParametricPlot3D[{
   u^Sin[r/R t] Sin[t + rotation],
   u^Sin[r/R t] Cos[t + rotation],
   Cos[r/R t] Log[u]
   }, {t, 0, R* 2 Pi}, {u, 1 + d (E - 1)/20, 1 + (1 + d) (E - 1)/20},
  PlotPoints -> {1000, 10}, PlotRange -> All, MaxRecursion -> 0,
  PlotStyle -> {RGBColor[1, 0.75, 0.6], Thickness[0.04]},
  Boxed -> False, Mesh -> False, Axes -> False]

plaht2[d_, rotation_] := ParametricPlot3D[{
   u^Sin[r/R t] Sin[t - rotation],
   u^Sin[r/R t] Cos[t - rotation],
   -Cos[r/R t] Log[u]
   }, {t, 0, R* 2 Pi}, {u, 1 + d (E - 1)/20, 1 + (1 + d) (E - 1)/20},
  PlotPoints -> {1000, 10}, PlotRange -> All, MaxRecursion -> 0,
  PlotStyle -> {RGBColor[0, 0.25, 0.4], Thickness[0.04]},
  Boxed -> False, Mesh -> False, Axes -> False]
plaht3[rotation_, viewvector_] := ParametricPlot3D[{
   u^Sin[r/R t] Sin[t - rotation],
   u^Sin[r/R t] Cos[t - rotation],
   -Cos[r/R t] Log[u]
   }, {t, 0, R* 2 Pi}, {u, 1, E}, PlotPoints -> {1000, 10},
  PlotRange -> All, MaxRecursion -> 0,
  PlotStyle -> {RGBColor[0, 0.25, 0.4], Thickness[0.04]},
  Boxed -> False, Mesh -> False, Axes -> False,
  ViewVector -> viewvector]
plaht4[rotation_, viewvector_] := ParametricPlot3D[{
   u^Sin[r/R t] Sin[t + rotation],
   u^Sin[r/R t] Cos[t + rotation],
   Cos[r/R t] Log[u]
   }, {t, 0, R* 2 Pi}, {u, 1, E}, PlotPoints -> {1000, 10},
  PlotRange -> All, MaxRecursion -> 0,
  PlotStyle -> {RGBColor[1, 0.75, 0.6], Thickness[0.04]},
  Boxed -> False, Mesh -> False, Axes -> False,
  ViewVector -> viewvector]
plaht5[rotation_] := ParametricPlot3D[{
   {u^Sin[r/R t] Sin[t + rotation],
    u^Sin[r/R t] Cos[t + rotation],
    Cos[r/R t] Log[u]},
   {u^Sin[r/R t] Sin[t - rotation],
    u^Sin[r/R t] Cos[t - rotation],
    -Cos[r/R t] Log[u]}
   }, {t, 0, R* 2 Pi}, {u, 1, E}, PlotPoints -> {1000, 10},
  PlotRange -> All, MaxRecursion -> 0,
  PlotStyle -> {{RGBColor[1, 0.75, 0.6],
     Thickness[0.04]}, {RGBColor[0, 0.25, 0.4], Thickness[0.04]}},
  Boxed -> False, Mesh -> False, Axes -> False]
plaht6[rotation_] := ParametricPlot3D[{
   {u^Sin[r/R t] Sin[t + rotation],
    u^Sin[r/R t] Cos[t + rotation],
    Cos[r/R t] Log[u]},
   {u^Sin[r/R t] Sin[t - rotation],
    u^Sin[r/R t] Cos[t - rotation],
    -Cos[r/R t] Log[u]}
   }, {t, 0, R* 2 Pi}, {u, 1, E}, PlotPoints -> {1000, 10},
  PlotRange -> {{-E, E}, {0, E}}, MaxRecursion -> 0,
  PlotStyle -> {{RGBColor[1, 0.75, 0.6],
     Thickness[0.04]}, {RGBColor[0, 0.25, 0.4], Thickness[0.04]}},
  Background -> LightGray, Boxed -> False, Mesh -> False,
  Axes -> False, ViewPoint -> Front]
Do[Export[StringJoin[ToString[rotation], ".png"],
  GraphicsGrid[{
    {plaht3[rotation, {5, -28, 5}], plaht4[rotation, {5, -28, 5}],
     plaht5[rotation, {5, -28, 5}]}, {Show[plaht5[rotation],
      ViewVector -> {50, -75, 150}],
     Show[plaht5[rotation], ViewPoint -> Top], plaht6[rotation]},
    {Show[plaht1[14, rotation ], plaht1[16, rotation ],
      plaht1[18, rotation ], plaht2[15, rotation],
      plaht2[17, rotation], plaht2[19, rotation],
      ViewVertical -> {-20, 15, 10}],
     Show[plaht1[14, rotation ], plaht1[16, rotation ],
      plaht1[18, rotation ], plaht2[15, rotation],
      plaht2[17, rotation], plaht2[19, rotation], ViewPoint -> Top],
     Show[plaht1[14, rotation ], plaht1[16, rotation ],
      plaht1[18, rotation ], plaht2[15, rotation],
      plaht2[17, rotation], plaht2[19, rotation],
      ViewPoint -> Front]}


    }, ImageSize -> 800, Spacings -> 0]],
 {rotation, 0, 6.2, 0.1}]