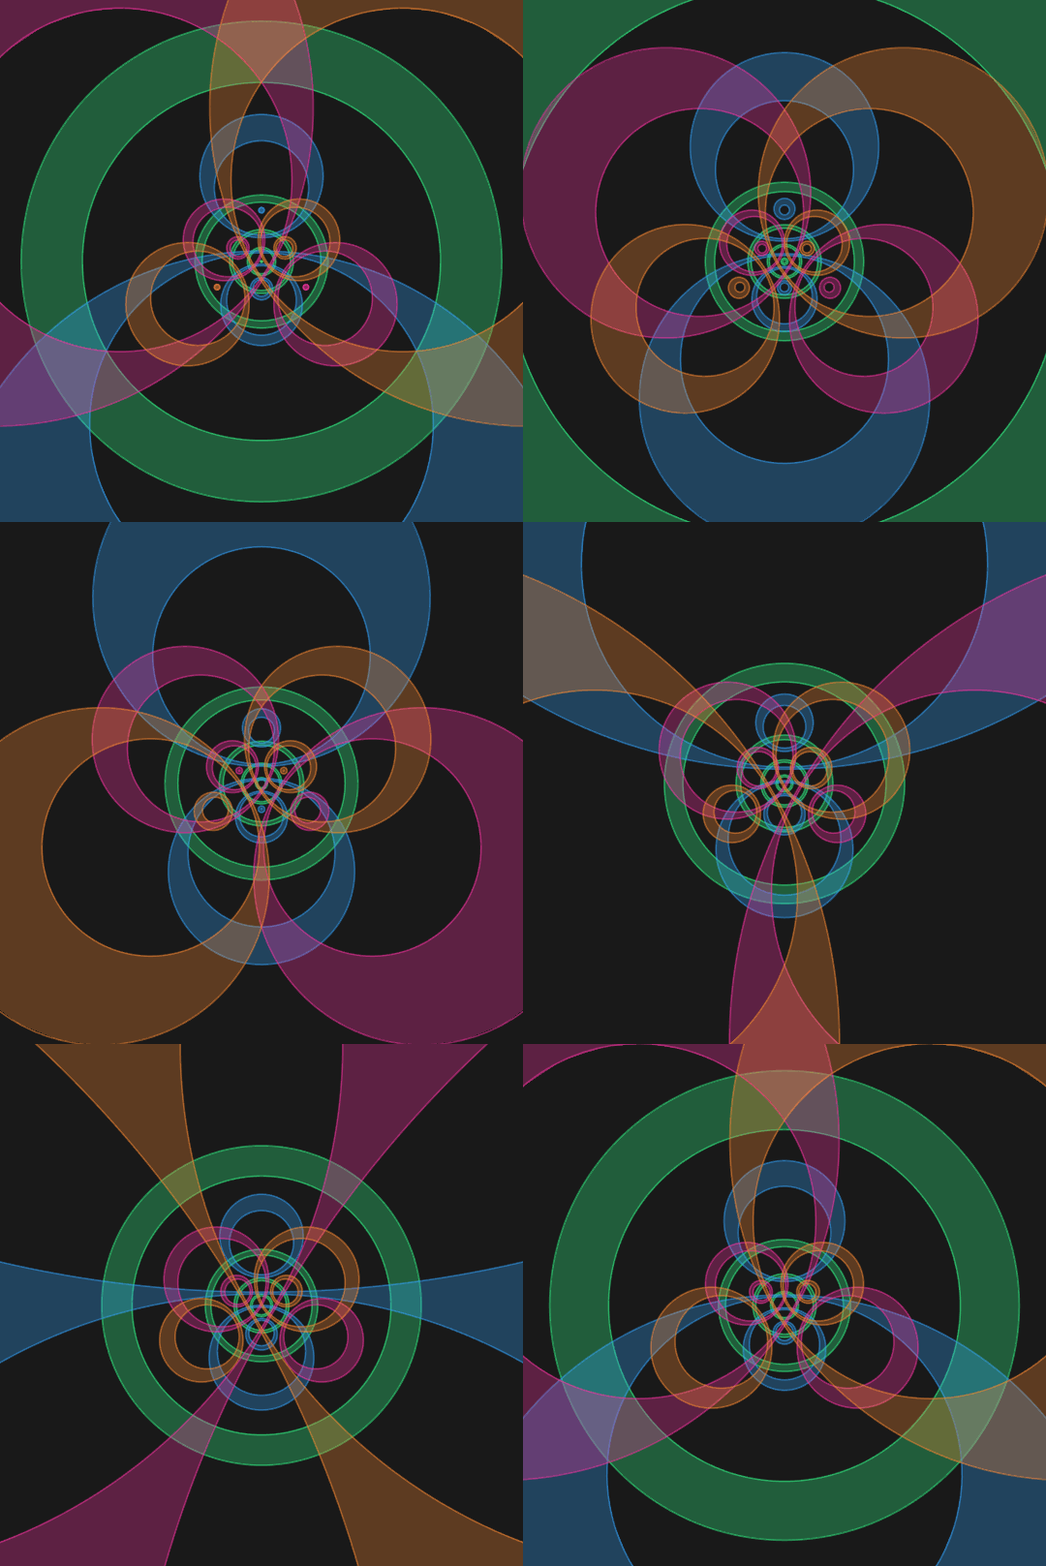
Tetra
This is the same basic idea as Interference and Dig In: in each case I have a collection of points on the unit sphere, I'm forming concentric circles around those points, and then stereographically projecting to the plane. In Interference, the chosen points were $(-1/\sqrt{2},1/\sqrt{2},0)$ and $(1/\sqrt{2},1/\sqrt{2},0)$, and I was just thinking of the circles as one-dimensional objects that were still circles under projection. In Dig In there was just a single point $(0,0,-1)$, and I projected the entire disk centered at that point bounded by each circle.
In this animation there are four points, which are vertices of a regular tetrahedron (notice that I'm just extracting the vertex coordinates of Mathematica's stored regular tetrahedron and taking the points to be their antipodal images [only because I wanted the green circles to grow rather than shrink]). But now I'm thinking of actually physically drawing the circles centered at each of these points, so the circles have thickness (or, more precisely, they are annuli). Circles map to circles under stereographic projection, but annuli don't map to annuli, since concentric circles don't necessarily map to concentric circles; this is what produces the colored shapes in the animation.
More precisely,
Cos[r + s + a] p[[i]] + Sin[r + s + a] (Cos[t] b[[i, 1]] + Sin[t] b[[i, 2]])
is the circle of radius r + s + a centered at p[[i]], so if we stereographically project and do a ParametricPlot with t varying from 0 to $2\pi$ and a varying from $-0.05$ to $0.05$, we get the colored regions. Just to explain the rest of the code, the Graphics object inside the Table then gets the borders of those regions and the ImageCompose business is to make everything look flat rather than stacked. The various annoying If statements are to prevent anything from going to infinity.
Needless to say, the resulting mess is much too slow to make into a Manipulate, so here's the code to generate the GIF:
Stereo[{x_, y_, z_}] := 1/(1 - z) {x, y};

tetra = Block[
   {inf, w = .05, b, n = 9/2,
    p = -Normalize[RotationTransform[Pi/6, {0, 0, 1}][#]] & /@
      PolyhedronData["Tetrahedron", "VertexCoordinates"],
    cols = RGBColor /@ {"#35ff8d", "#35a7ff", "#ff35a7", "#ff8d35", "#fafafa"}},
   b = Orthogonalize[NullSpace[{#}]] & /@ p;
   ParallelTable[
      ImageCompose[
       Graphics[Background -> GrayLevel[.1], ImageSize -> 540],
       Flatten[
        Table[
         inf = i >= 2 && s == Pi/n && ArcCos[1/3] - Pi/n - w <= r <= ArcCos[1/3] - Pi/n + w;
         Show[
          ParametricPlot[
           Stereo[Cos[r + s + a] p[[i]] + Sin[r + s + a] (Cos[t] b[[i, 1]] + Sin[t] b[[i, 2]])],
           {t, If[inf, If[i == 2, 0., Pi/16.5] + Pi/100, 0], If[inf, If[i == 2, 0., Pi/16.5] + 2 Pi - Pi/100, 2 Pi]}, {a, -w, w},
           BoundaryStyle -> None, PlotPoints -> {50, 3}, PlotStyle -> Directive[Opacity[.3], cols[[i]]]],
          Graphics[{
            FaceForm[None],
            EdgeForm[
             Directive[Opacity[.5], cols[[i]], Thickness[.003]]],
            Table[
             Polygon[
              Table[
               Stereo[Cos[r + s + a] p[[i]] + Sin[r + s + a] (Cos[t] b[[i, 1]] + Sin[t] b[[i, 2]])],
               {t, 0., 2 Pi, 2 Pi/600}]], {a, {-w, w}}]}],
          PlotRange -> 6.5, ImageSize -> 540, Axes -> None,
          Frame -> False],
         {i, 1, 4}, {s, 0., Pi - If[(i == 1 && r >= Pi/(2 n) - w) || r > Pi/(2 n), 1, 0] Pi/n, Pi/n}],
        1]
       ],
      {r, 0., Pi/n - #, #}] &[Pi/(100 n)]
   ];

Export[NotebookDirectory[] <> "tetra.gif", tetra,
 "DisplayDurations" -> 3/100, "AnimationRepetitions" -> Infinity]