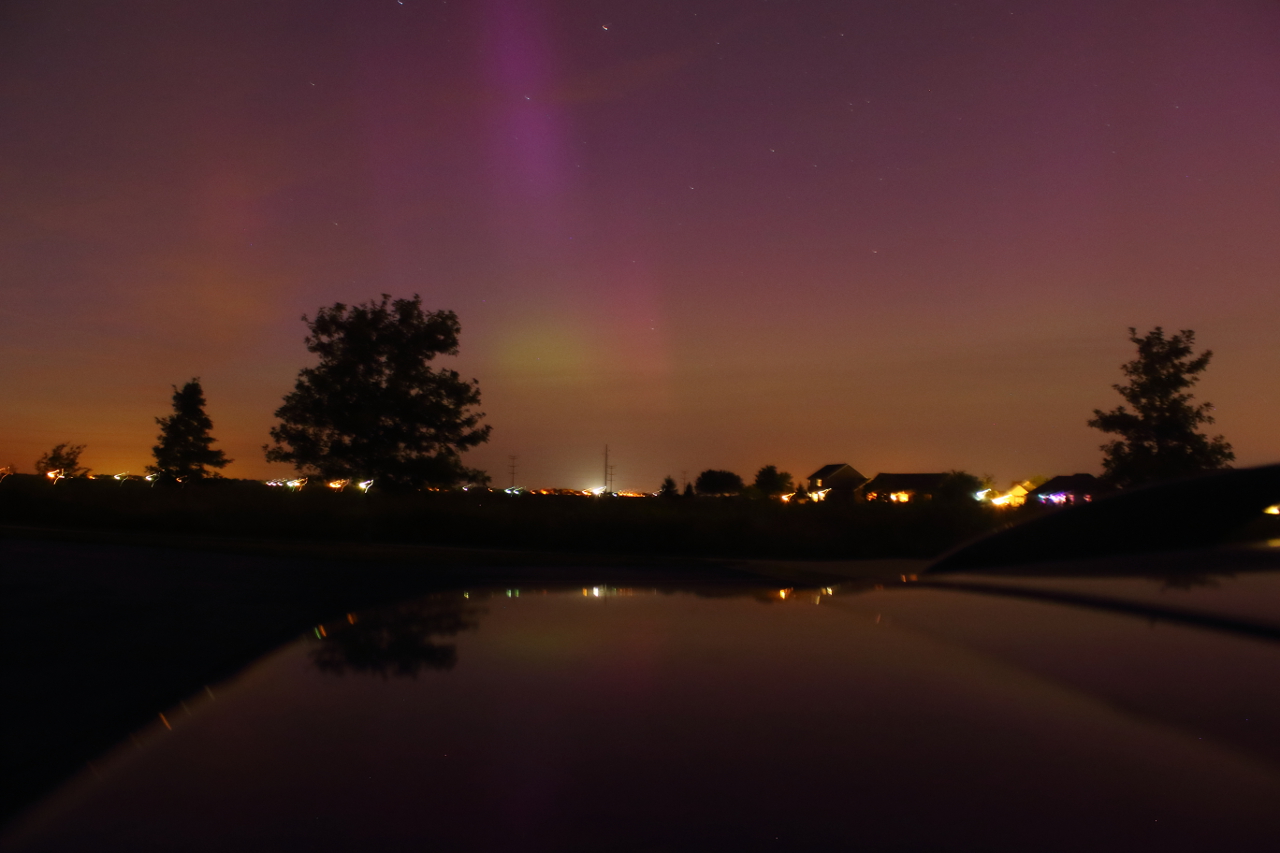
Full gallery: https://www.flickr.com/photos/jeff-m-bryant/albums/72157686287351384
Here are some pictures of the aurora borealis I took last night from southwest Champaign between 8:15 and 8:30 PM CDT (you can also click on the image or direct link to go to the full gallery). I had to get out away from the city lights so I observed from a park on the edge of town. The colors were not so obvious to the unaided eye, but the camera picked them up nicely.
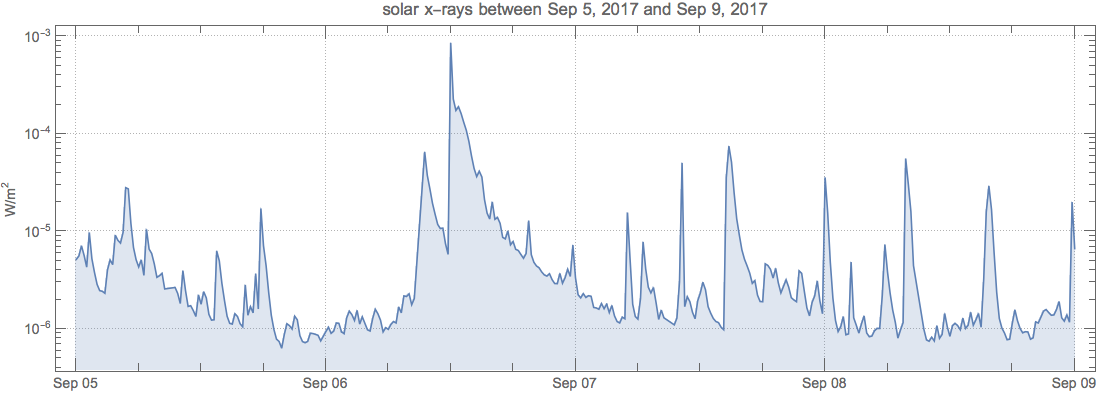
The solar flare responsible for this outburst of aurora activity happened on the morning of Sep 6 (in the Central timezone) or about Noon GMT. You can see this in the large spike in solar X-rays seen below. The strength of this flare was in the strongest class of solar flare and caused shortwave radio blackouts in Europe, Africa, and the Atlantic Ocean.
query1="solar x-rays between Sep 5, 2017 and Sep 9, 2017";
data1=WolframAlpha[query1,{{"SolarXRayFluxEntrained:SpaceWeatherData",4},"TimeSeriesData"}][[1]];

DateListLogPlot[data1, style, PlotLabel -> query1]

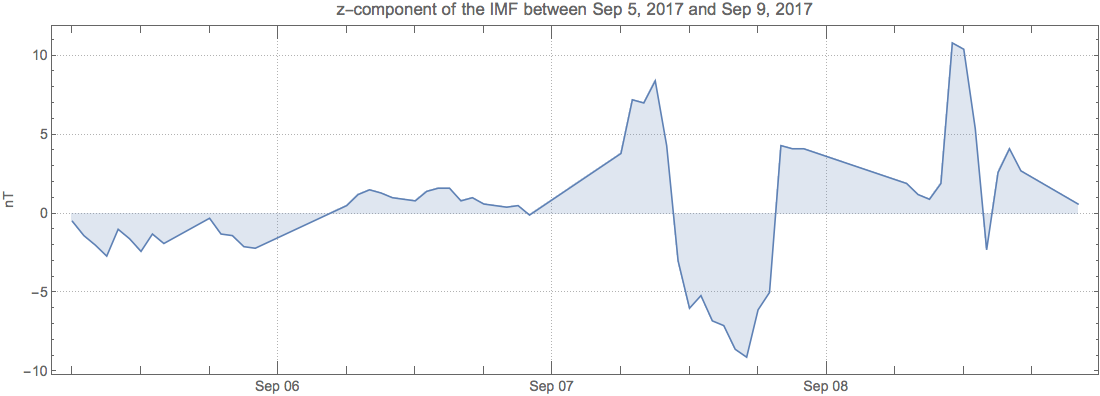
A strong flare isn't enough to guarantee auroras. First, the flare must result in a coronal mass ejection (CME) that throws solar plasma towards Earth. Second, the magnetic field of that CME must be oriented in such a way that it partially cancels the Earth's magnetic field which would normally shield us from such effects. The problem is that you don't know the orientation of the magnetic field CME until it gets close enough to Earth to be measured which is usually VERY close. So, you may know something is coming, but you have no idea what effect it might have, if any. However, this CME was well aligned and if you look at the z-component of the interplanetary magnetic field (IMF) as measured by the ACE satellite near the Sun-Earth L1 point, you can see that it swung strongly south due to the CME. This means that the overall strength of the Earth's magnetic field was weakened to the effects of the CME and the solar plasma was able to penetrate and interact with the Earth's atmosphere and make it glow as it was ionized.
query2="z-component of the IMF between Sep 5, 2017 and Sep 9, 2017";
data2=WolframAlpha[query2,{{"BzTimeSeries:SpaceWeatherData",1},"TimeSeriesData"}];

DateListPlot[data2,style,PlotLabel->query2]

The combination of effects allowed the aurora to be visible much further south than is typical. Hopefully, lingering effects will continue tonight and allow more heightened auroral activity.
NOTE: styles in the above plots are defined as follows:
style={FrameLabel->Automatic,PlotTheme->"Detailed",AspectRatio->1/3,ImageSize->1100,Filling->Axis,BaseStyle->14};