Message Boards Message Boards

0
|
6551 Views
|
4 Replies
|
3 Total Likes
View groups...
Share
Share this post:

[?] Combine 3 figures together?

Posted 7 years ago

I want to combine those 3 figures together be this problem appear to me

plot = Show[
  LineIntegralConvolutionPlot[{{y, -y - 2 x - 2}, {"noise", 500, 
     500}}, {x, -3, -1}, {y, -4, 4},
   ColorFunction -> "Rainbow", LightingAngle -> 0, 
   LineIntegralConvolutionScale -> 3, Frame -> False],
  LineIntegralConvolutionPlot[{{y, -y}, {"noise", 500, 500}}, {x, -1, 
    1}, {y, -4, 4},
   ColorFunction -> "Rainbow", LightingAngle -> 0, 
   LineIntegralConvolutionScale -> 3, Frame -> False],
  LineIntegralConvolutionPlot[{{y, -y - 2 x + 2}, {"noise", 500, 
     500}}, {x, 1, 3}, {y, -4, 4},
   ColorFunction -> "Rainbow", LightingAngle -> 0, 
   LineIntegralConvolutionScale -> 3, Frame -> False],
  PlotRange -> {{-3, 3}, {-4, 4}}]]

enter image description here

4 Replies

May be this piece of code is more appropriate:

Show[
LineIntegralConvolutionPlot[{Piecewise[{{{y, -y - 2 x - 2}, -4 <= x <= -1}, {{y, -y}, -1 <= x <= 1}, {{y, -y - 2 x + 2}, 1 <= x <= 4}}], {"noise", 500, 500}}, {x, -3, 3}, {y, -5, 5}, 
ColorFunction -> "Rainbow", LightingAngle -> 0, LineIntegralConvolutionScale -> 3, Frame -> False], PlotRange -> {{-3, 3}, {-5, 5}}]

enter image description here

There is one extra square bracket at the end. If it's deleted, then:

Show[
LineIntegralConvolutionPlot[{{y, -y - 2 x - 2}, {"noise", 500, 500}}, {x, -3, -1}, {y, -4, 4}, ColorFunction -> "Rainbow", 
LightingAngle -> 0, LineIntegralConvolutionScale -> 3, Frame -> False],
LineIntegralConvolutionPlot[{{y, -y}, {"noise", 500, 500}}, {x, -1, 1}, {y, -4, 4}, ColorFunction -> "Rainbow", LightingAngle -> 0, LineIntegralConvolutionScale -> 3, Frame -> False], 
LineIntegralConvolutionPlot[{{y, -y - 2 x + 2}, {"noise", 500, 500}}, {x, 1, 3}, {y, -4, 4}, ColorFunction -> "Rainbow", 
LightingAngle -> 0, LineIntegralConvolutionScale -> 3, Frame -> False],
PlotRange -> {{-3, 3}, {-4, 4}}]
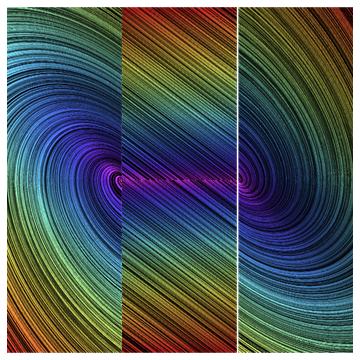
enter image description here

Thank you very much but i want to combine this 3 figures in one figure and eliminate this discontinuity this plot for continuous flow field but defined with different equation in each range

thank you very much , this is really helpful

Reply to this discussion
Community posts can be styled and formatted using the Markdown syntax.
Reply Preview
Attachments
Remove
or Discard

Group Abstract Group Abstract