Click on the image to zoom. Then click your browser back button to return to reading the post.
Intro
This is a response to the [CALL] Reddit DataViz Battle JAN2018: Visualize the Growth Rates of Algae:
http://community.wolfram.com/groups/-/m/t/1257547
Details
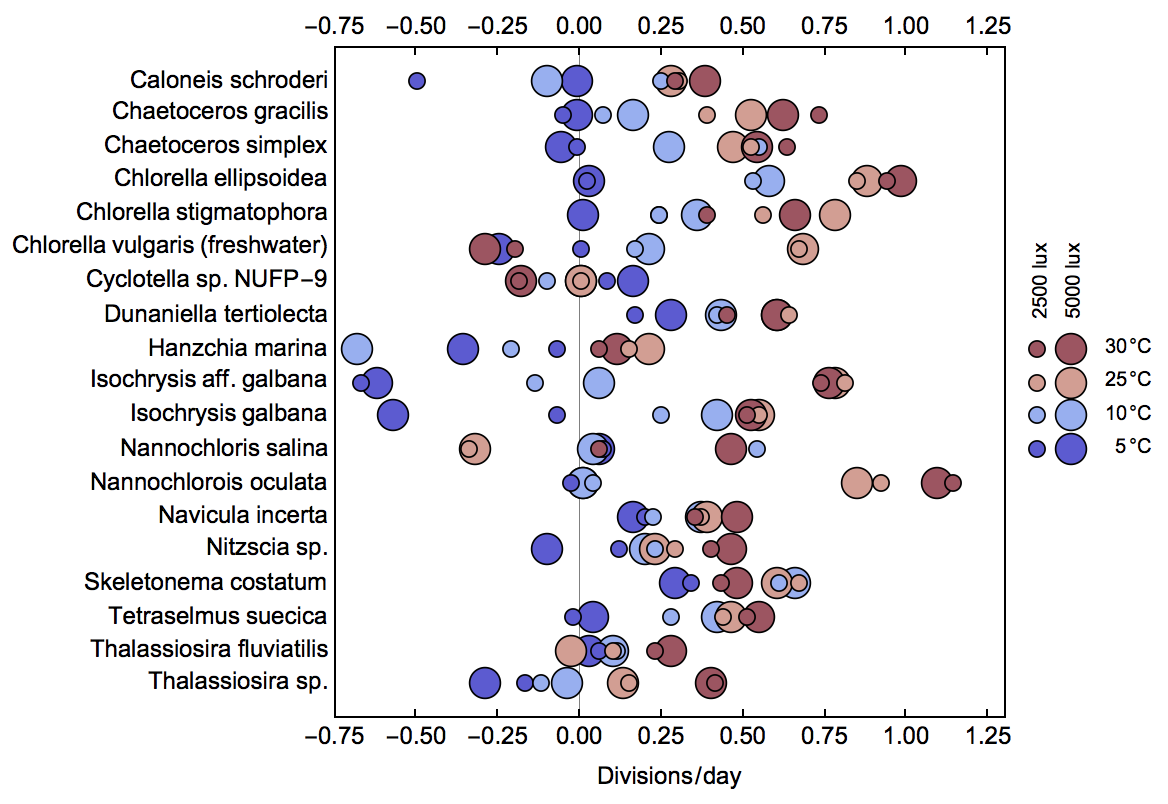
Here is my go at it. It is difficult to visualize 4D data (name, divisionrate, temperature, and light intensity). So this is some kind of bubble chart.
Let's first get the data and transform it:
raw=Import["http://archive.is/Pcb1G","Data"]/."0..06"->.06;
ClearAll[CombineMe]
CombineMe[row_List,headers_List]:=Prepend[First[row]]/@(Flatten/@Transpose[{Rest[row],headers}])
data=Cases[raw,{_String,__?NumberQ},Infinity]/.x_List/;First[x]=="Temperature":>{"Temperature",5,5,10,10,25,25,30,30};
header=Transpose[data[[;;2,2;;]]];
rows=data[[3;;]];
alldata=SortBy[Join@@(CombineMe[#,header]&/@rows),{First,Minus@*Last}];
Now define the colors, legend, and so on:
types=DeleteDuplicates[alldata[[All,1]]];
heights=1+Length[types]-Range[Length[types]];
heightrules=Thread[types->heights];
labels=MapThread[Text[#1,{-1,#2},{1,0}]&,{types,heights}];
temps=Union[alldata[[All,3]]];
colors=Lighter[#,0.25]&@*ColorData["ThermometerColors"]/@Rescale[temps];
temprules=Thread[temps->colors];
sizes=Union[alldata[[All,4]]];

f=115000.0;
pts=With[{p={#2,#1/.heightrules},s=#4/f},{Black,PointSize[s+0.005],Point[p],#3/.temprules,PointSize[s],Point[p]}]&@@@alldata;
pr={{-0.75,1.3},{0,20}};
hticks={#,NumberForm[#,{\[Infinity],2}]}&/@Range[-0.75,1.25,0.25];
vticks=MapThread[List[##,0]&,{heights,types}];

legend=Table[With[{p={1.3+0.1si,7+ti},s=sizes[[si]]/f},{Black,PointSize[s+0.005],Point[p],temps[[ti]]/.temprules,PointSize[s],Point[p]}],{ti,Length[temps]},{si,Length@sizes}];
legend={legend,Table[Text[ToString[temps[[ti]]]<>"  \[Degree]C",{1.75,7+ti},{1,0}],{ti,Length[temps]}]};
legend={legend,Table[Text[ToString[sizes[[si]]]<>" lux",{1.3+0.1 si,13},{0,0.4},{0,1}],{si,Length@sizes}]};

Graphics[{pts,legend},Frame->True,AspectRatio->1,ImageSize->600,PlotRange->pr,FrameLabel->{"Divisions  /  day",""},FrameTicks->{{vticks,None},{hticks,hticks}},GridLines->{{{0,Gray}},{}},FrameStyle->Directive[Black,12],PlotRangeClipping->False,ImagePadding->{{165, 100}, {40,20}}]
It is important to be able to read the division rate precisely so it can not be encoded in colors, so it is encoded here as the x-position. The size and color encode the luminous emittance and temperature, respectively:


