Riccardo,
minima are the maxima of the negative function! Let data be your data from above, then you can do:
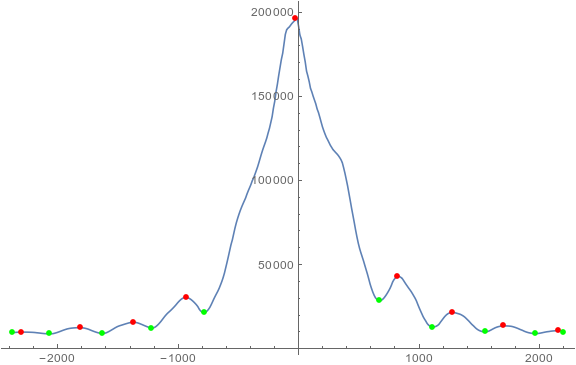
maxIndx = First /@ FindPeaks[Last /@ data];
minIndx = First /@ FindPeaks[Last /@ -data];
ListLinePlot[data, ImageSize -> Large, Epilog -> {PointSize[.01], Red, Point[data[[maxIndx]]], Green, Point[data[[minIndx]]]}]
which gives:
Regards -- Henrik


